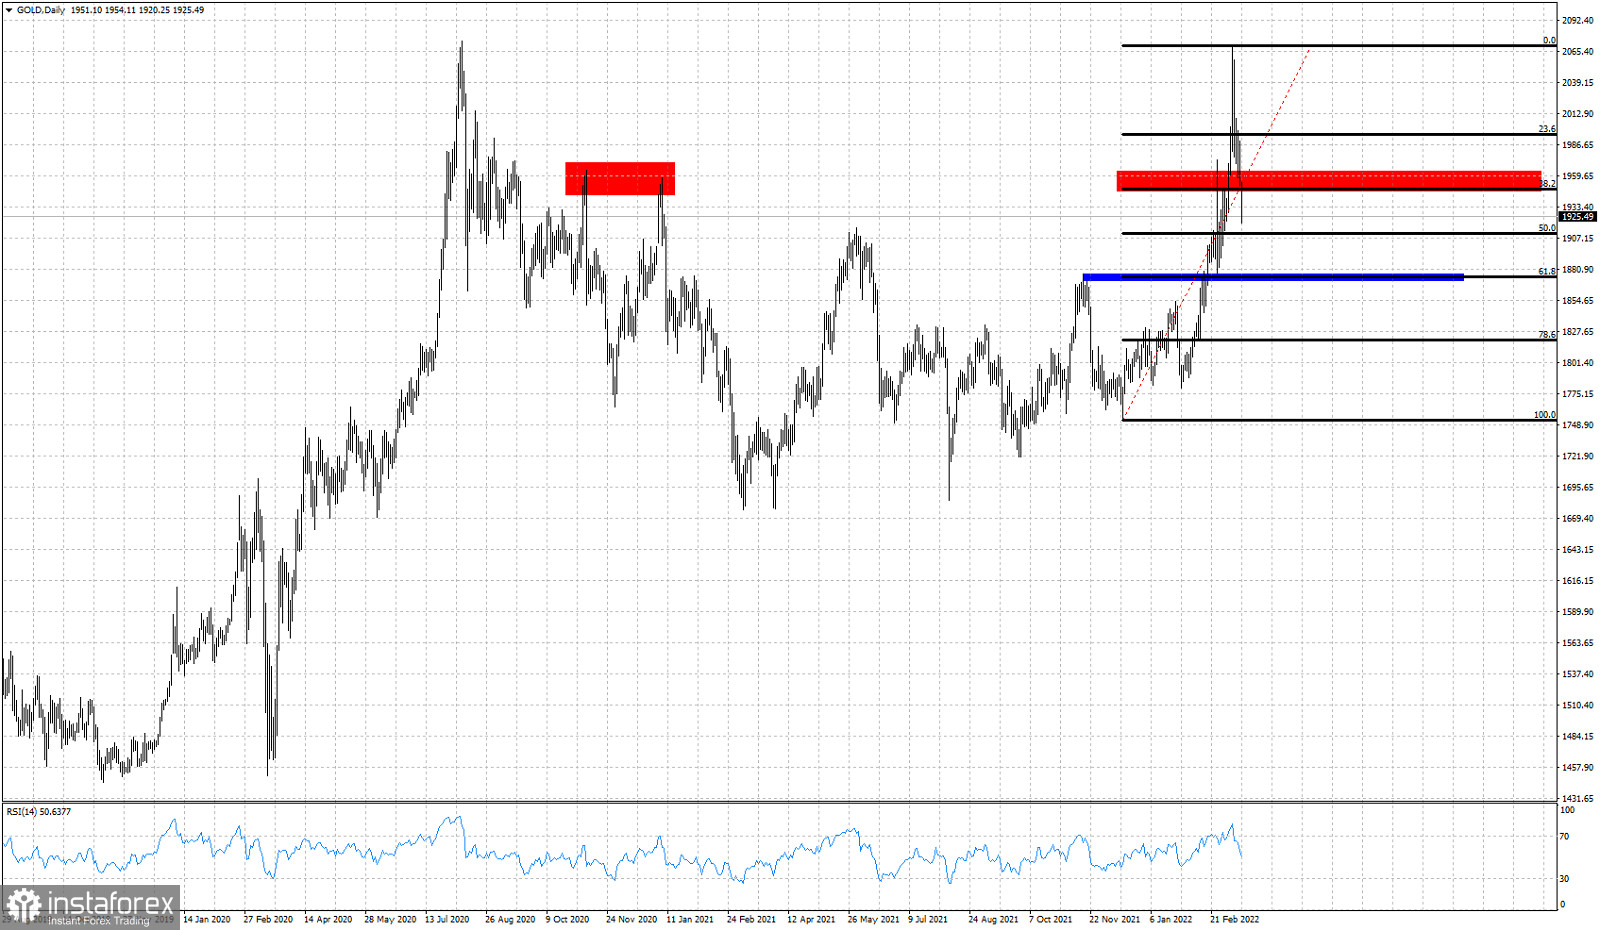
In previous post we warned traders that Gold price justified a pull back towards $1,950 and maybe lower. In yesterday's analysis we also mentioned that if Gold price were to break below $1,950 and the 38% Fibonacci retracement, we should expect more selling pressure.

Blue rectangle- next major support
Black lines - Fibonacci retracements
Gold price broke below the 38% Fibonacci support and is moving towards our next Fibonacci level (50%) at $1,910. However we should not rule out a deeper correction towards the blue horizontal support and 61.8% Fibonacci retracement at $1,873. Major support remains at $1,750 and as long as price is above this level, we consider this pull back as a counter trend one.
 English
 Русский
 Bahasa Indonesia
 Bahasa Malay
 ไทย
ไทย Español
 Deutsch
 Български
 Français
 Tiếng Việt
 中文
中文 বাংলা
বাংলা हिन्दी
 Čeština
 Українська
 Română

