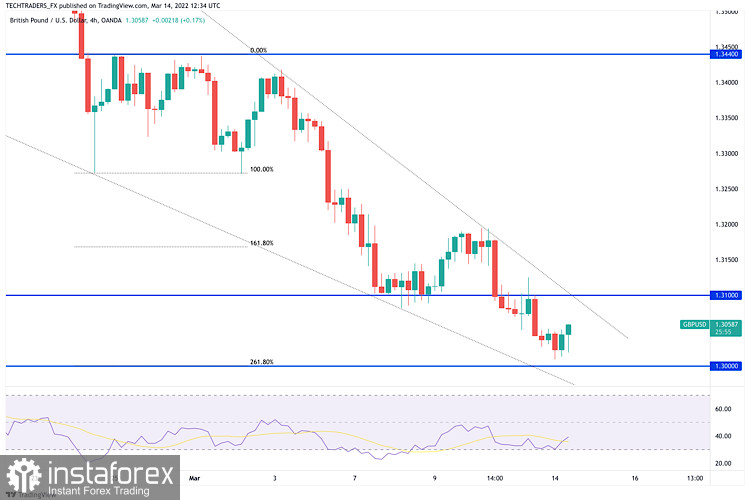
GBP/USD staged a rebound after dropping to its lowest level since November 2020 at 1.3010 on Monday but seems to be having a difficult time clearing 1.3050. In the absence of high-tier data releases, the risk perception continues to impact the pair's action.
GBP/USD faces interim resistance at 1.3050 (static level). In case a four-hour candle closes above that level, the pair could extend its recovery toward 1.3100 (20-period SMA on the four-hour chart, static level) and 1.3150 (static level).
On the downside, 1.3000 (psychological level) aligns as critical support. If that level turns into resistance, 1.2920 (static level) could be seen as the next bearish target.
In the meantime, the Relative Strength Index (RSI) indicator on the four-hour chart is still below 50, suggesting that the pair is still in a corrective phase.
 English
 Русский
 Bahasa Indonesia
 Bahasa Malay
 ไทย
ไทย Español
 Deutsch
 Български
 Français
 Tiếng Việt
 中文
中文 বাংলা
বাংলা हिन्दी
 Čeština
 Українська
 Română

