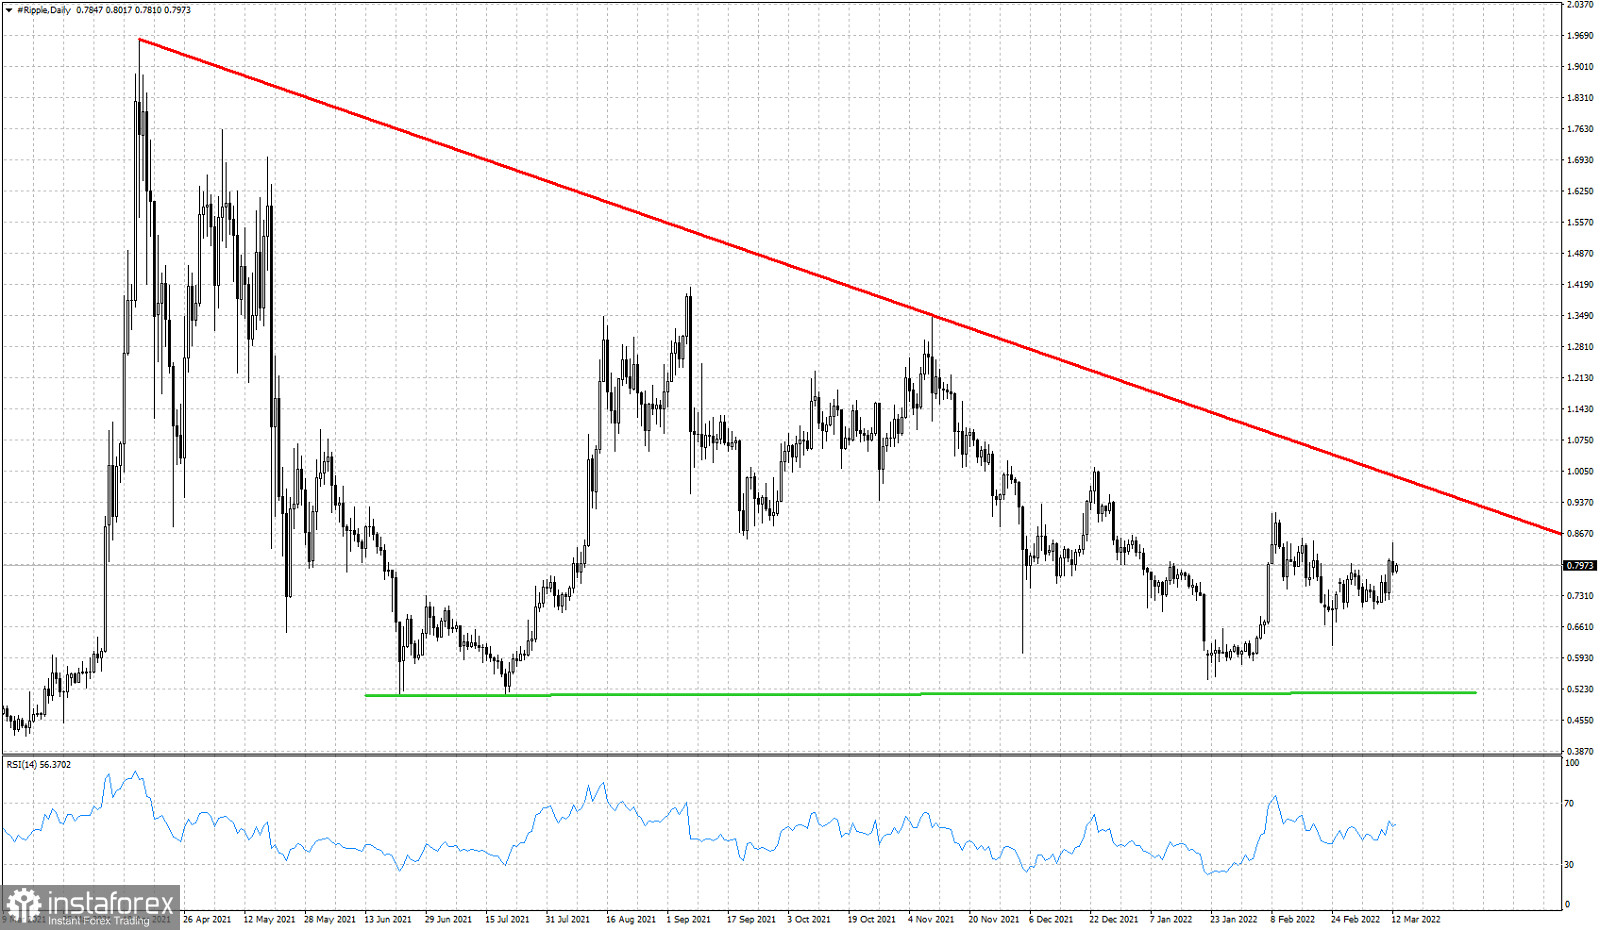
XRPUSD is bouncing towards $0.80 after the recent low at $0.61 at the end of February. As we mentioned in previous posts, XRPUSD continues to trade inside the long-term triangle pattern and there is potential for a move higher towards the upper triangle boundary. This boundary is currently around $1.

Green line - support
XRPUSD is trading above the key green line support. As long as this is the case, bulls continue to have hopes, but the bigger formation is not bullish. The lower highs are a sign of weakness. In order to change things to bullish, traders will need to push price above the red resistance trend line and upper triangle boundary. Only this will be a bullish signal. With the battle with SEC continuing and no clear result in the near future, it is logical to assume that price will continue its sideways movement inside the triangle pattern until it runs out of space to move. Then we will see a break out.
 English
 Русский
 Bahasa Indonesia
 Bahasa Malay
 ไทย
ไทย Español
 Deutsch
 Български
 Français
 Tiếng Việt
 中文
中文 বাংলা
বাংলা हिन्दी
 Čeština
 Українська
 Română

