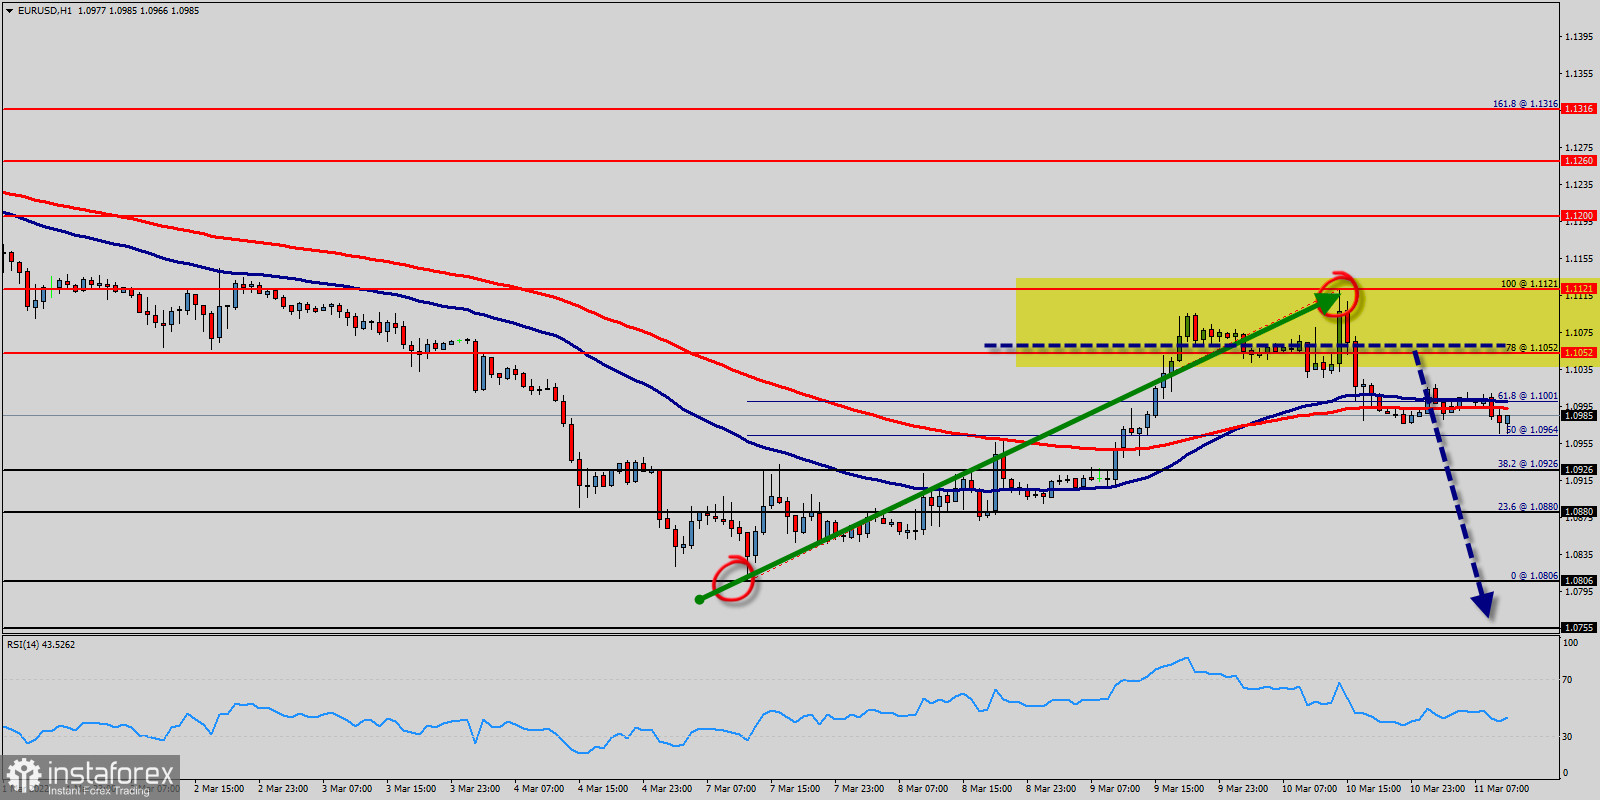
The EUR/USD pair gained bearish pace below the resistance levels of 1.1121 and 1.1052. The EUR/USD pair moved into a bearish zone below the 1.1121 and 1.1052 levels. The EUR/USD pair even extended decline below the 1.1052 level before slightly recovering. It is currently showing bearish signs below 1.1121 (major resistance) and still might extend losses.
We do not think that there is a fresh increase, because the price could face resistance near the 1.1052 level. The main resistance is now forming near the 1.1121 level.
The important support is the Fibonacci level at 1.1121, followed by a short-term Fibonacci level at 1.1052.
The direction of the EUR/USD pair into the close is likely to be determined by trader reaction to 1.1052 and 1.0880.
The main trend is down according to the daily swing chart. A trade through 1.0880 (S2) will change the main trend to down. A move through 1.0806 will signal a resumption of the downtrend.
On the hourly chart, EUR/USD pair is testing support (1.0962) - the moving average line Moving Average (100) and (50) - price is still below the Moving Average 100 and 50.
Overall, The EUR/USD pair price is showing bearish signs below the price of 1.1052. If The EUR/USD pair breaks the 1.0962 level, there is a risk of a move towards the 1.0880 and 1.0806 levels in the near term.
 English
 Русский
 Bahasa Indonesia
 Bahasa Malay
 ไทย
ไทย Español
 Deutsch
 Български
 Français
 Tiếng Việt
 中文
中文 বাংলা
বাংলা हिन्दी
 Čeština
 Українська
 Română

