GBP/USD
Analysis:
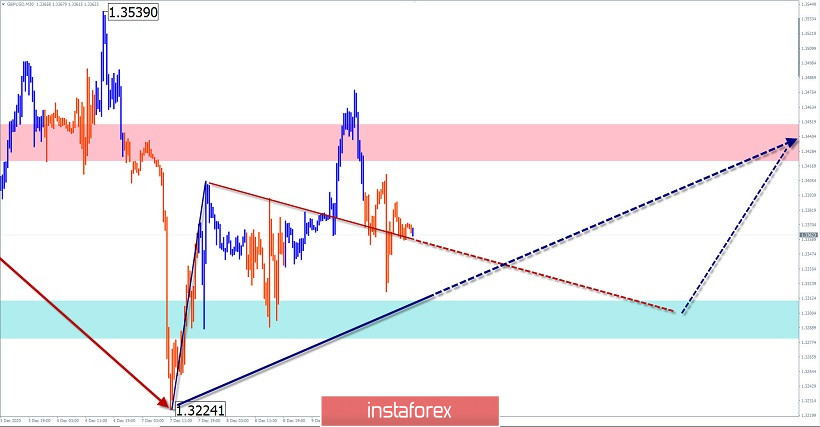
The upward section of the British pound chart from September 10 completes the bullish wave construction of a larger time frame. After the hidden correction ended on December 7, a reversal model is formed for the next breakthrough in the main exchange rate.
Forecast:
Today, in the first half of the day, a flat mood of movement with a downward vector is likely. The decline is likely no further than the estimated support. At the end of the day, you can expect activation and a return to the bullish direction.
Potential reversal zones
Resistance:
- 1.3420/1.3450
Support:
- 1.3310/1.3280
Recommendations:
Until the decline is complete, trading on the pound market may become unprofitable. We recommend skipping this section and looking for buy signals at the end of it.

USD/JPY
Analysis:
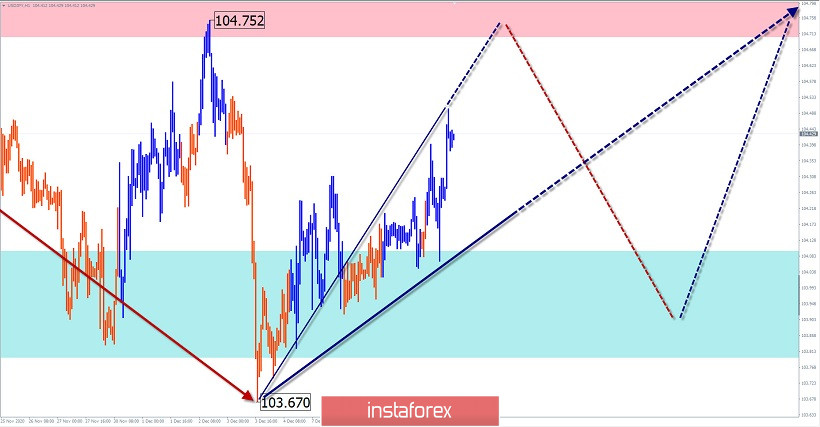
A downward trend is forming in the Japanese yen market. Its last section counts down from November 9. The wave develops mainly in the lateral plane. On December 3, the formation of the correction phase of the movement began.
Forecast:
A general flat mood is expected today. In the first half of the day, you can expect an upward vector. The calculated resistance is located at the lower border of the potential reversal zone of the higher TF. A reversal and downward movement of the price is likely at the end of the day or tomorrow.
Potential reversal zones
Resistance:
- 104.70/105.00
Support:
- 104.10/103.80
Recommendations:
Trading on the pair's market is only possible within an intra-session. Purchases are risky. It is recommended to track reversal signals for selling the pair in the area of the calculated resistance.

Explanation: In the simplified wave analysis (UVA), waves consist of 3 parts (A-B-C). The last incomplete wave is analyzed. The solid background of the arrows shows the formed structure, and the dotted background shows the expected movements.
Note: The wave algorithm does not take into account the duration of the instrument's movements in time!
 English
 Русский
 Bahasa Indonesia
 Bahasa Malay
 ไทย
ไทย Español
 Deutsch
 Български
 Français
 Tiếng Việt
 中文
中文 বাংলা
বাংলা हिन्दी
 Čeština
 Українська
 Română

