Crypto Industry News:
According to Finbold data, there was a record accumulation of BTC at the beginning of the month. The increase in the number of addresses storing the oldest cryptocurrency shows that investors are increasingly interested in this market.
Breeders who have been holding their Bitcoins for at least a year now make up more than half of all owners. The increase in the number of BTC hodlers is significant because nearly 57% of investors have been holding their cryptocurrencies for over twelve months. This means that there are more and more people who believe that the value of the cryptocurrency can increase in the long term.
The record number of hodlers also shows that most investors did not care about recent declines or information about plans to regulate the US market.
As for Bitcoin's correlation with equities, it is still high in contrast to the correlation with gold which continues to appreciate. At the time of writing, an ounce of gold is $ 2,045, up from $ 1,821 a month ago. This translates into the lowest correlation with gold since last August.
Technical Market Outlook
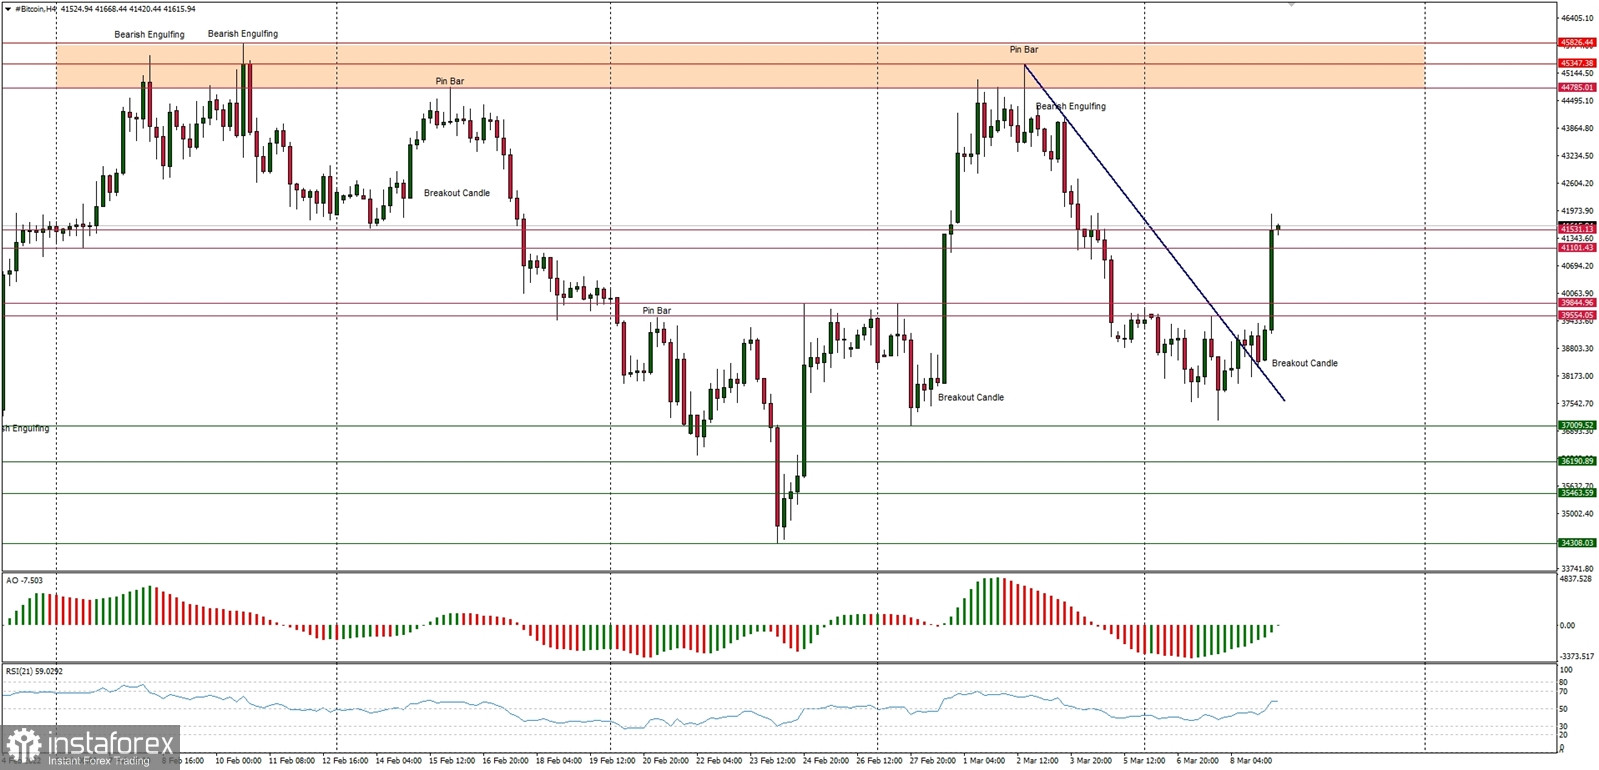
The BTC/USD pair had been rallying back above the level of $40k and a new, local high was made at $41,892 (at the time of writing the article). The local trend line resistance had been violated around the level of $38,000, but only a clear and sustained breakout above the 38% Fibonacci retracement located around $46,674 level would change the outlook to more bullish in the near time. The nearest technical support is seen at the level of $41,101 and $41,531.
Weekly Pivot Points:
WR3 - $50,991
WR2 - $48,083
WR1 - $42,916
Weekly Pivot - $40,144
WS1 - $35,041
WS2 - $32,033
WS3 - $26,666
Trading Outlook:
The market still keeps trying to bounce after over the 60% retracement made since the ATH at the level of $68,998 was made. The level of $45,427 is the key technical resistance for bulls, but the game changing technical supply zone is seen between the levels of $52,033 - $52,899. When this zone is clearly broken, the BTC is back to the up trend, otherwise the bearish pressure might push down the BTC towards the level of $29,254.

 English
 Русский
 Bahasa Indonesia
 Bahasa Malay
 ไทย
ไทย Español
 Deutsch
 Български
 Français
 Tiếng Việt
 中文
中文 বাংলা
বাংলা हिन्दी
 Čeština
 Українська
 Română

