To open long positions on GBPUSD, you need:
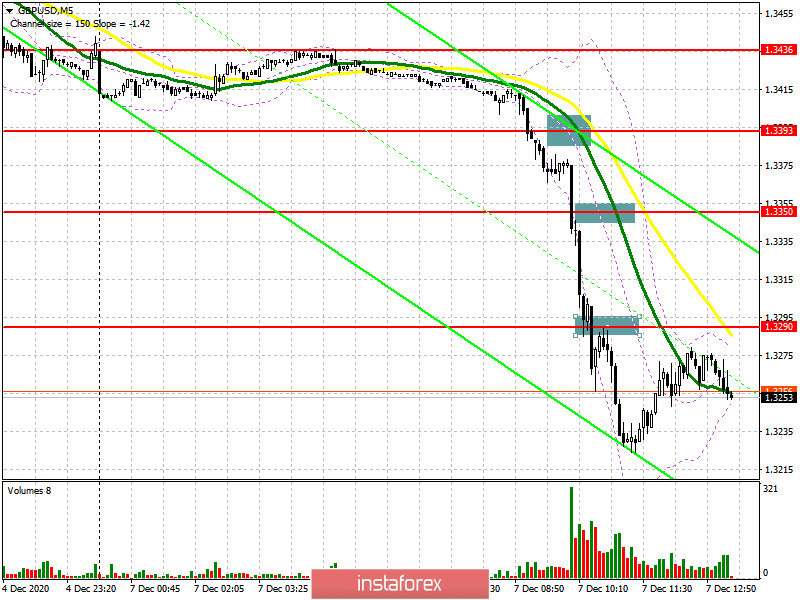
In my morning forecast, I paid attention to the sale of the pound below the level of 1.3393, and purchases in the support area of 1.3290. But given the news on Brexit and the statements made by the EU's chief negotiator, the market is not on the side of buyers right now. Volatility promises to be even higher today in the second half of the day. The breakdown and consolidation below 1.3393 did not lead to the formation of a sell signal, as there was no reverse test. Purchases on the rebound from 1.3350 brought losses, as there was no rebound. And only a break and consolidation below the level of 1.3290 with a test on the reverse side, led to the formation of a signal to sell the pound. The downward movement was about 60 points.

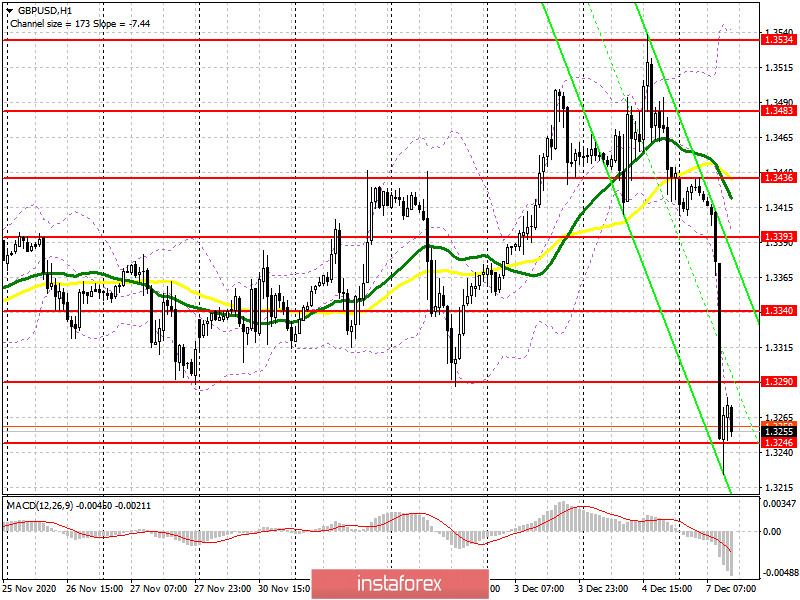
At the moment, new support of 1.3246 has formed and the initial task of the bulls is to maintain control over this level. Only the formation of a false breakout in the second half of the day will lead to a new wave of growth of the pound. An equally important target for buyers is a breakout and consolidation above the resistance of 1.3290, where the stop orders of speculative sellers are located. A top-down test of this level forms an excellent entry point for long positions. In this case, we can count on a more powerful bullish momentum in the area of 1.3340. However, only good news on the Brexit trade agreement will open the way to a return to the resistance area of 1.3393 and lead to an update of the area of 1.3436, where I recommend taking the profits. This afternoon, Boris Johnson will have a conversation with European Commission President Ursula von der Leyen, who will decide the outcome of this "confrontation". If the level of 1.3246 breaks and there is no activity from buyers, it is best to postpone long positions until the minimum of 1.3198 is updated or buy the pound if a false breakout is formed in the support area of 1.3114.
To open short positions on GBPUSD, you need:
Statements by chief negotiator Michel Barnier that there is no progress on negotiations led to the collapse of the British pound in the first half of the day. Now the bears should focus on the resistance of 1.3290, as only the formation of a false breakout will be a signal to sell the pound in the second half of the day. The main target will be to break through and consolidate below the support of 1.3246, which will lead to another wave of sell-off of the pound and reach the lows of 1.3198 and 1.3114, where I recommend fixing the profits. If it becomes clear that there will be no agreement now, you can look for a stop of the pound in the area of 1.2976 and 1.2856. If there is no bear activity around 1.3290, it is best to abandon sales before the resistance test of 1.3340. But at the same time, you need to understand that if a Brexit agreement is reached, the pound can quickly fly to the highs of 1.3393 and 1.3436 or even higher to the area of 1.3483 and 1.3534.

Let me remind you that in the COT reports (Commitment of Traders) for December 1, there is a significant interest in the British pound, as many traders were counting on reaching an agreement on Brexit. Long non-commercial positions rose from 30,838 to 37,087. At the same time, short non-commercial positions decreased from 47,968 to 44,986. As a result, the negative non-commercial net position was -7,899 against -17,130 a week earlier. All this still speaks for the maintenance of control by the sellers of the British pound and their preponderance in the current situation, however, the market is beginning to gradually return to risks, and reaching a trade agreement will help it in this.
Signals of indicators:
Moving averages
Trading is below 30 and 50 daily averages, which indicates that the pound will continue to fall in the short term.
Note: The period and prices of moving averages are considered by the author on the hourly chart H1 and differ from the general definition of classic daily moving averages on the daily chart D1.
Bollinger Bands
In the case of growth, the upper limit of the indicator around 1.3534 will act as a resistance.
Description of indicators
- Moving average (moving average determines the current trend by smoothing out volatility and noise). Period 50. The graph is marked in yellow.
- Moving average (moving average determines the current trend by smoothing out volatility and noise). Period 30. The graph is marked in green.
- MACD indicator (Moving Average Convergence / Divergence - moving average convergence / divergence) Fast EMA period 12. Slow EMA period 26. SMA period 9
- Bollinger Bands (Bollinger Bands). Period 20
- Non-profit speculative traders, such as individual traders, hedge funds, and large institutions that use the futures market for speculative purposes and meet certain requirements.
- Long non-commercial positions represent the total long open position of non-commercial traders.
- Short non-commercial positions represent the total short open position of non-commercial traders.
- Total non-commercial net position is the difference between the short and long positions of non-commercial traders.
 English
 Русский
 Bahasa Indonesia
 Bahasa Malay
 ไทย
ไทย Español
 Deutsch
 Български
 Français
 Tiếng Việt
 中文
中文 বাংলা
বাংলা हिन्दी
 Čeština
 Українська
 Română

