 English
  Русский
 Bahasa Indonesia
 Bahasa Malay
 ไทย
ไทย Español
 Deutsch
 Български
 Français
 Tiếng Việt
 中文
中文 বাংলা
বাংলা हिन्दी
 Čeština
 Українська
 Română

Trend analysis (Fig. 1).
Today, the market may continue to move downward from the level of 1.2121 (closing of Friday's daily candlestick), with the first lower target – a pullback level of 14.6%, 1.2093 (red dotted line). If this line is tested, we can expect the continuation of the upper work with the target of 1.2177 - the resistance level (blue bold line).
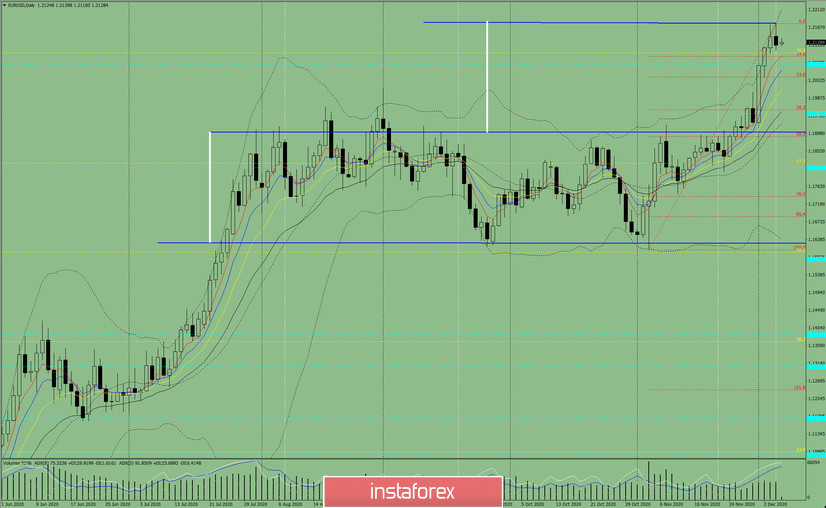
Figure 1 (Daily Chart).
Comprehensive analysis:
- Indicator analysis - down
- Fibonacci levels - down
- Volumes - down
- Candlestick analysis - down
- Trend analysis - down
- Bollinger bands - down
- Weekly chart - down
General conclusion:
Today, the price may continue to move downward with the target of the pullback level of 14.6%, 1.2093 (red dotted line). If this line is tested, we can expect the continuation of the upper work with the target of 1.2177 - the resistance level (blue bold line).
Alternative scenario: from the level of 1.2121 (closing of the Friday daily candlestick), the pair may work downward in order to reach the pullback level of 14.6%, 1.2093 (red dotted line). If this line is tested, we can expect the lower work to continue with the target of 1.2072 - the historical support level (blue dotted line).