Reason for the trading strategy (technically):
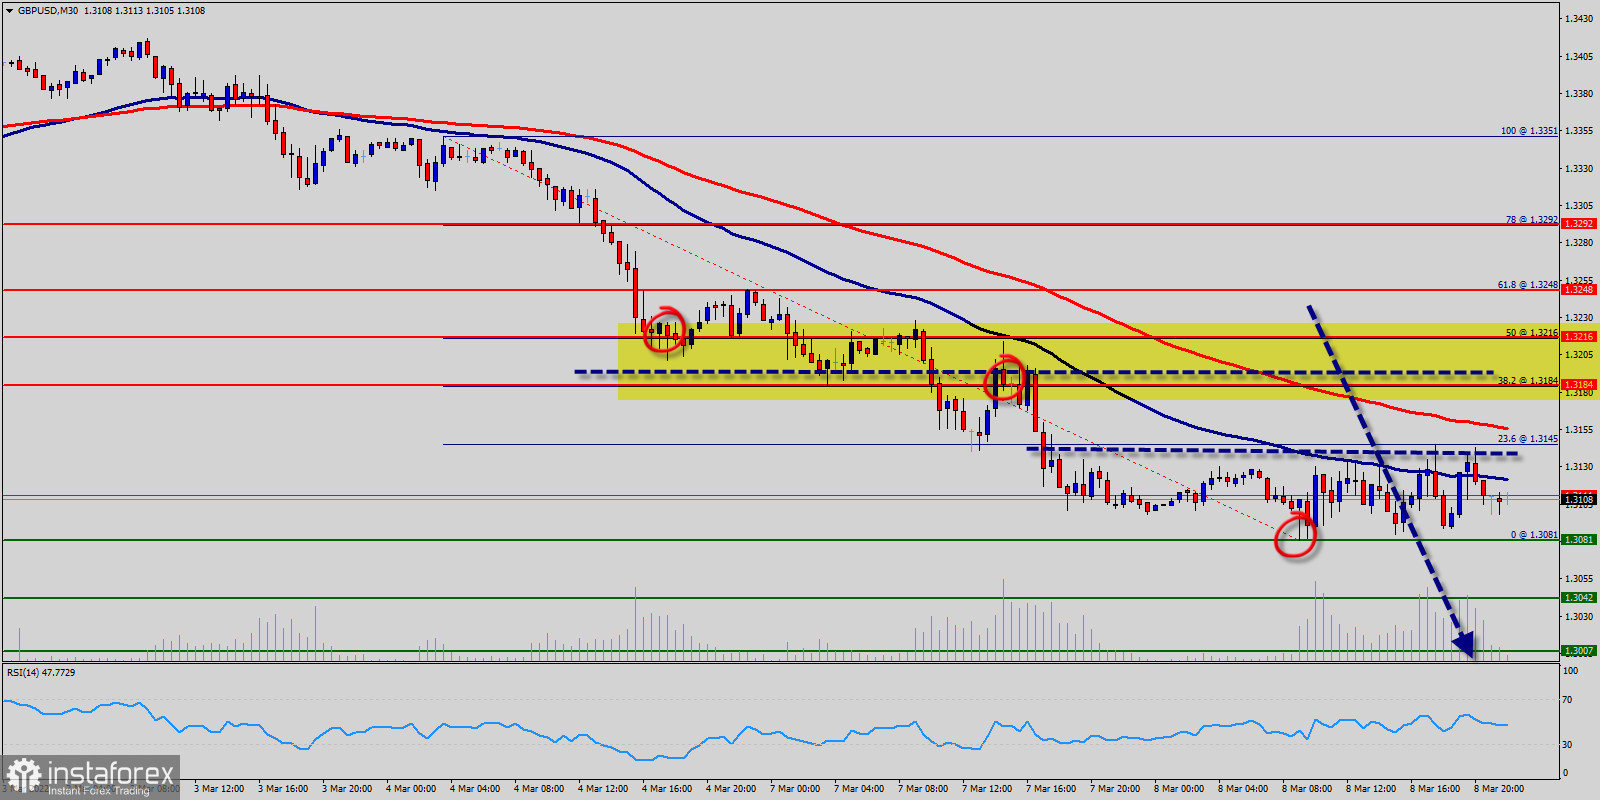
The GBP/USD price extended losses and tested the 1.3081 support. Perhaps, the Cable price surged to 1.3081 before correcting higher. Today, in the M30 chart, the current rise will remain within a framework of correction.
However, if the pair fails to pass through the level of 1.3081 , the market will indicate a bearish opportunity below the strong resistance level of 1.3081 (the level of 1.3081 coincides with the last bullish wave - 32.8% of Fibonacci - daily pivot point).
Since there is nothing new in this market, it is not bullish yet. The GBP/USD pair might continue to move down below the 1.3081 support zone. The next key support is near 1.3081 level, below which there is a risk of a move towards the 1.3081 handle.
The EUR/USD pair has been trading in a downward inclined channel since February 2022. The pair has been moving lower since. After testing and failing to hold below the bottom trendline of the channel - Last top price 1.3351.
RSI is seeing major resistance below 60% and a bearish divergence vs price also signals that a reversal is not impending.
If the trend breaks the support level of 1.3081, the pair is likely to move downwards continuing the development of a bearish trend to the level 1.3042 in order to test the daily support 2 (horizontal green line). Support 3 sets at the price of 1.0307.
 English
 Русский
 Bahasa Indonesia
 Bahasa Malay
 ไทย
ไทย Español
 Deutsch
 Български
 Français
 Tiếng Việt
 中文
中文 বাংলা
বাংলা हिन्दी
 Čeština
 Українська
 Română

