GBP/USD 15M

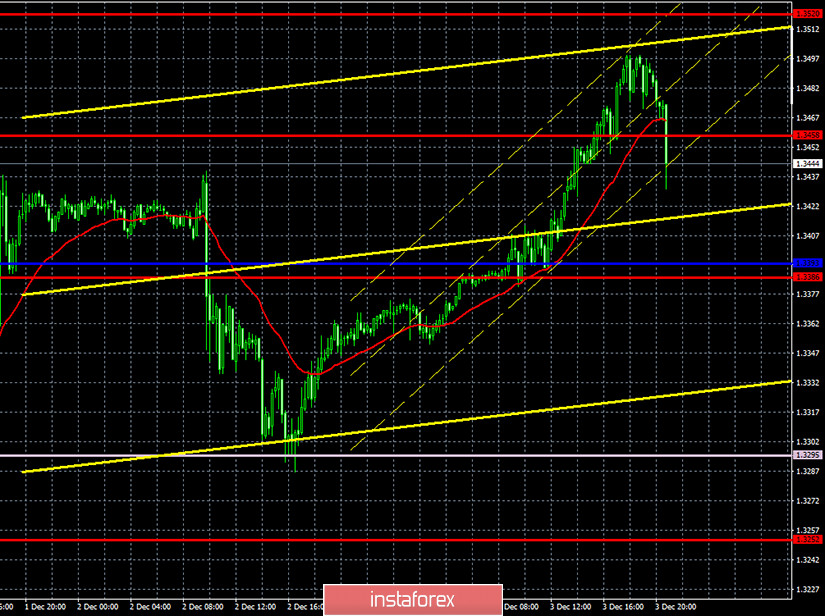
The lower linear regression channel is directed to the upside on the 15-minute timeframe, which fully corresponds with what is happening on the hourly timeframe, where the direction of movement changes every 12-15 hours. Thus, the key now is the hourly timeframe, since the course of movement is much visible there.
GBP/USD 1H

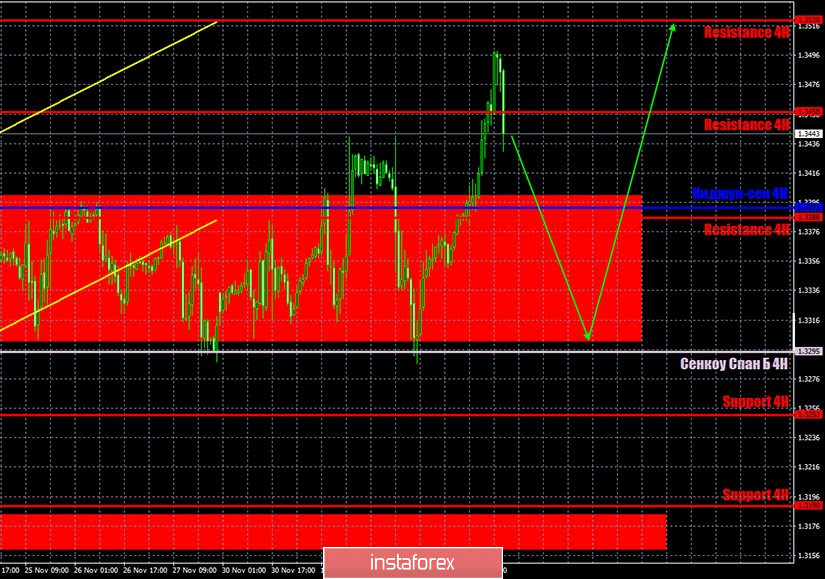
The GBP/USD pair dropped to the lower line of the horizontal channel on Thursday, which is shown in the chart with a large red rectangle, rebounded off it and resumed an even stronger upward movement than the previous day. And so, during the past day, the pair left the range of 1.3300-1.3400 again, this time it was much more confident. However, this does not mean that trading the pair has become more convenient. Now the pair is jumping back and forth, but with an upward slope. It is up to traders to decide whether they want to open trades with such complex movements. We would like to note that there is no trendline or trend channel now. Therefore, it is possible to navigate when opening trade deals but only on the Kijun-sen line. But it is not a strong support or resistance in a flat. And now it is almost flat, but highly volatile. Thus, it is quite possible that the pair will fall by 100-150 points today.
COT report

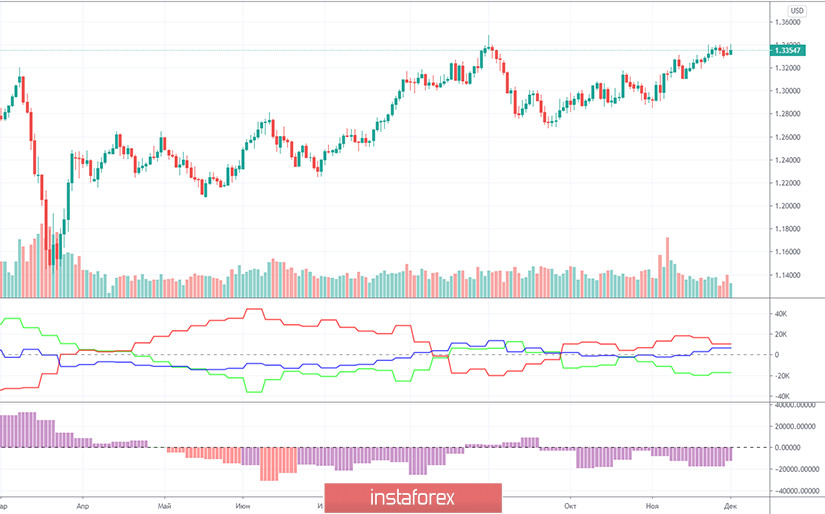
The GBP/USD pair rose by 135 points in the last reporting week (November 17-23), so we can expect professional traders to become even more bullish in the Commitment of Traders (COT) report for this period. And that's what we saw. If the strengthening of the bullish mood came as a very big surprise for the euro's case, this on the other hand is not unexpected for the pound. One has only to look at two indicators that display net positions. The first indicator and its green and red lines are constantly changing the direction of their movement. This means that the net positions of non-commercial and commercial traders are constantly changing their trends. The mood becomes more bullish than bearish. The second indicator also shows that there is no trend in the most important group of non-commercial traders. Their mood also becomes more bullish and vice versa. Therefore, professional traders' desire to buy the pound increased in the reporting week, and next week it may decrease. Therefore, we cannot draw a conclusion, based on the COT report, about the pound's prospects in the coming weeks. Moreover, the foundation predicts its fall, and the technique predicts further growth.
No fundamental background for the British currency on Thursday. A few comments from the EU and UK representatives regarding the talks on the trade deal, and nothing more. Moreover, the comments are contradictory. Some diplomats say that they have doubts about the deal. Others say that the agreement is on the home stretch. Traders seem to believe and listen only to the latter, which is why the pound continues to rise. Ordinary macroeconomic statistics play little or no role now. The UK Services PMI rose in November, but still remained below 50.0. Meanwhile, the ISM index of business activity in the US services sector slightly fell, but remained well above the 50.0 level. Thus, neither one nor the other report could be the reason why the pound grew by 150 points, which did not even stop last night.
No major UK releases scheduled for Friday. But there will be several important reports in America. We doubt that the markets need any macroeconomic statistics right now. Nevertheless, the unemployment report for November, the change in the average wage in November, as well as NonFarm Payrolls for November will be released today. By and large, only the latter indicator can affect the course of trading in the pound/dollar pair on December 4. The forecast is +469,000 new jobs outside the agricultural sector. If the actual value of the report is higher, then the dollar will finally be able to rise. But a value below the forecast can also cause the dollar to grow, since the pound is now heavily overbought. Also, traders may be prone to a correction on Friday. Logically, a powerful spiral of downward movement should now follow for the pound.
We have two trading ideas for December 4:
1) Buyers for the pound/dollar pair surged. If they manage to keep quotes above the 1.3300-1.3400 horizontal channel and above the Kijun-sen line (1.3393), then after rebounding from any support, you can open new long positions with targets at resistance levels 1.3458 and 1.3520. Take Profit in this case will be up to 100 points. At the same time, there is a high probability of high-volatility movement, which persisted in the last week.
2) Sellers do not have the upperhand on the situation. We recommend selling the pound/dollar pair with targets at the support levels of 1.3252 and 1.3190 if the bears manage to get the pair to settle below the Senkou Span B line (1.3295). Take Profit in this case can be up to 80 points.
Forecast and trading signals for EUR/USD
Explanations for illustrations:
Support and Resistance Levels are the levels that serve as targets when buying or selling the pair. You can place Take Profit near these levels.
Kijun-sen and Senkou Span B lines are lines of the Ichimoku indicator transferred to the hourly timeframe from the 4-hour one.
Support and resistance areas are areas from which the price has repeatedly rebounded off.
Yellow lines are trend lines, trend channels and any other technical patterns.
Indicator 1 on the COT charts is the size of the net position of each category of traders.
Indicator 2 on the COT charts is the size of the net position for the "non-commercial" group.
 English
 Русский
 Bahasa Indonesia
 Bahasa Malay
 ไทย
ไทย Español
 Deutsch
 Български
 Français
 Tiếng Việt
 中文
中文 বাংলা
বাংলা हिन्दी
 Čeština
 Українська
 Română

