EUR/USD – 24H.

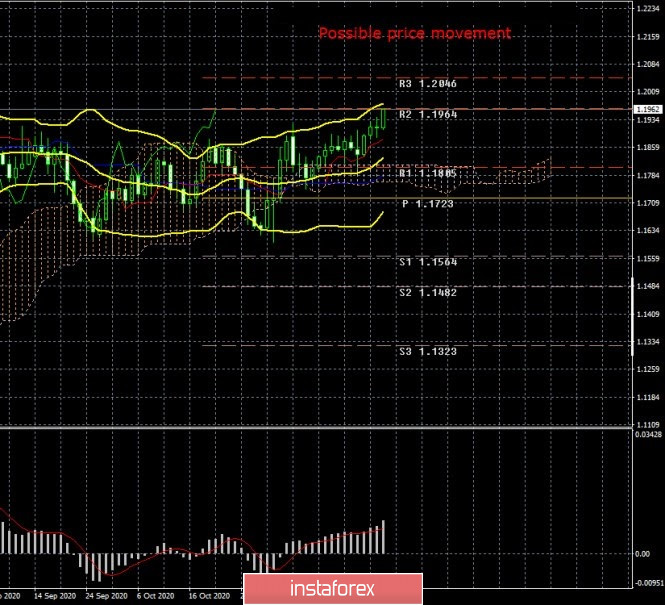
Over the past week, the EUR/USD pair has grown by more than 100 points. The pair's volatility increased slightly after the past week and a very remarkable event happened – the pair again tried to overcome the upper line of the side channel of 1.1700-1.1900. You can even say that it was successful. If in the middle of the week the quotes were pushing and stomping around the upper line of this channel, breaking it by 5-10 points, then on Friday a fairly powerful upward movement followed, which significantly increased the probability of forming a new upward trend. However, we remind traders that quotes have already left this channel twice and also rushed to the level of 1.2000 and then returned to the side channel again. Thus, we believe that this upward movement will not necessarily take the form of a new trend. Moreover, the fundamental background is now such that it is impossible to draw a clear conclusion.
COT report.

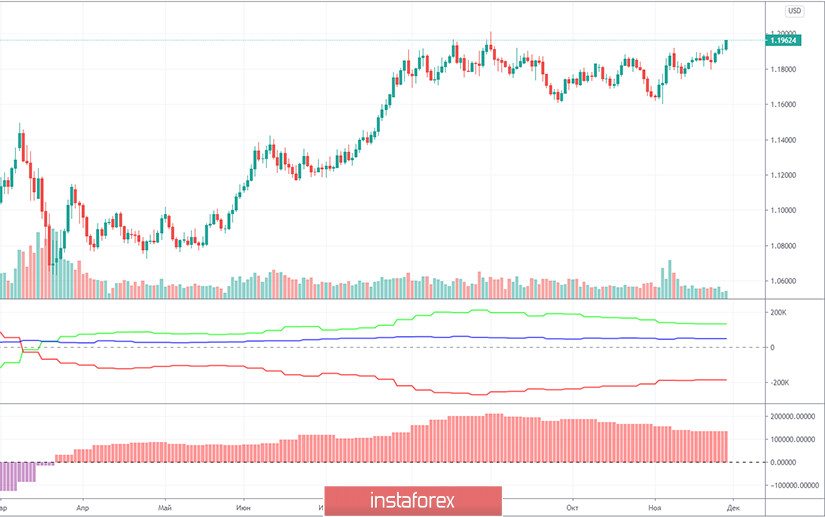
During the last reporting week (November 17-23), the EUR/USD pair declined by 10 points. That is, price changes were again minimal. This indicates a low activity of traders, primarily major traders, whose transactions are displayed in the COT reports. What did the new report show us? It showed us very little. As a week earlier, professional traders opened a small number of new contracts during the week - only about 3,700. Given that the total number of contracts in the "Non-commercial" group is more than 300 thousand, that 3,700 is only about 1%. There is absolutely nothing to say about the mood of the major players either. Buy-contracts were opened for 700 units more than sell-contracts. As you can imagine, these changes do not allow us to conclude that the mood of professional traders has sharply become more "bullish" or "bearish". The net position has not changed much. Thus, as a result, we can say that there are practically no changes, and the overall picture of the situation remains the same. That is, the COT report data still leaves a high probability that the upward trend was completed around the level of 1.2000. Even though the pair's quotes are now very close to this level back. However, the first indicator continues to show the movement of the green and red lines towards each other (net positions of commercial and non-commercial traders), which means that the euro currency should become cheaper, and the previous trend is over. The net position of non-commercial traders (the second indicator) has been signaling a decline for several months. This means that major players are looking more and more towards selling the euro currency.
What can we say about the fundamental background of the past trading week? It was quite weak. At the very least, we can't single out any events that affected the course of trading. There were few macroeconomic reports, and most of them were ignored again. In general, there are no changes in the state of the US and EU economies. The heads of the US and EU central banks continue to look to the future with a high degree of fear, even despite the creation of a vaccine against the "coronavirus". Both Jerome Powell and Christine Lagarde insist that the economy requires new stimulus measures and call on governments to help, as well as prepare to expand their programs to support the economy. Thus, it is impossible to conclude that the situation in Europe or America has changed, so the euro currency has again started to enjoy high demand. Rather, the opposite is true. The fundamental background has not changed much over the past week, so it is quite strange for us to observe the resumption of the fall of the US currency when there are no good reasons for this. We were waiting for a new fall in the dollar for 2 or 3 weeks when the United States was completely under the water of a political crisis that also threatened to turn into a constitutional one. However, now in America, on the contrary, there is a lull. Donald Trump has agreed to hand over power. The current President lost all the courts. Of course, there are certain concerns about his activities in the last 2 months, but so far Trump has not done anything that could harm the US economy or the dollar. Moreover, we believe that it is the euro currency that looks less attractive at this time since the economy will shrink due to the "lockdown" in Europe.
Trading plan for the week of November 30-December 4:
1) The pair's quotes are quite a big step towards a new upward trend (or a resumption of the old one), however, we still strongly doubt that the quotes will be able to go above the level of 1.2000. Both the fundamental background and COT reports speak against further growth of the euro. However, if there are no technical reasons to expect a fall (and there are none now), then you should expect growth and trade on the lower charts for an increase.
2) To be able to sell the EUR/USD pair, you need to at least wait for the price to consolidate below the Kijun-sen and Senkou Span B lines. But even in this case, the potential for a downward movement will be limited to the level of 1.1700. An upward trend has now formed on the lower timeframes, so short positions are not relevant.
Explanation of the illustrations:
Price levels of support and resistance (resistance/support) – target levels when opening purchases or sales. You can place Take Profit levels near them.
Ichimoku indicators, Bollinger bands, MACD.
Support and resistance areas – areas that the price has repeatedly bounced from before.
Indicator 1 on the COT charts – shows the net position size of each category of traders.
Indicator 2 on the COT charts – the net position size for the "Non-commercial" group.
 English
 Русский
 Bahasa Indonesia
 Bahasa Malay
 ไทย
ไทย Español
 Deutsch
 Български
 Français
 Tiếng Việt
 中文
中文 বাংলা
বাংলা हिन्दी
 Čeština
 Українська
 Română

