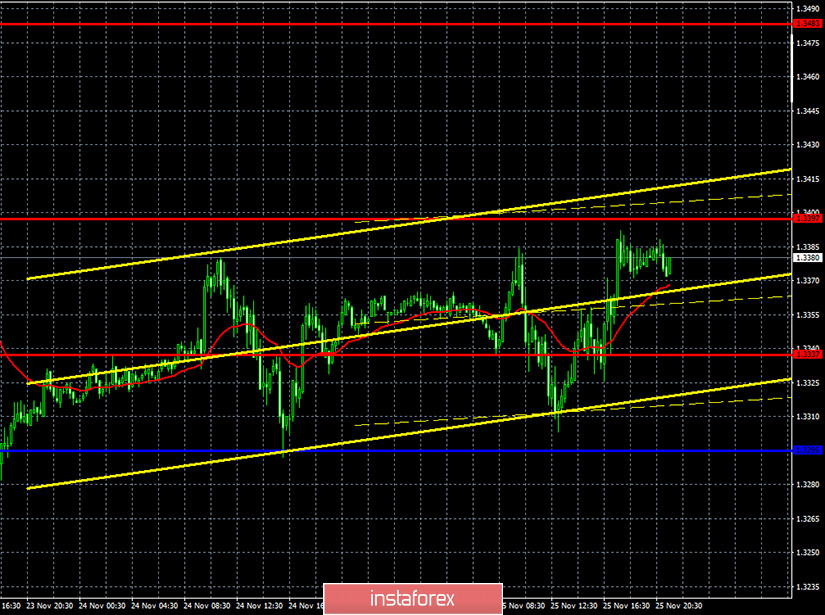
GBPUSD 1H
The GBP/USD pair moved identically to the EUR/USD pair by moving in different directions on Wednesday, November 25. It resulted in the price rebounding from the lower line of the rising channel. Yes, the pound is facing an upward trend, in contrast to the euro. Accordingly, buyers continue to hold the initiative in their hands and the chances of sustaining the upward movement remain very good, from a purely technical point of view. The fundamental background is another matter. We have analyzed in previous articles that the pound does not have any fundamental support now. Moreover, if we take all the news from Great Britain over the past months into account, it becomes clear that the pound should, rather, have become cheaper. However, this is not the case. The pound continues to rise and does so almost every day. In total, this currency has risen in price by almost 20 cents since March. But as long as the price is within the rising channel and above the critical line, all our assumptions based on the foundation remain only assumptions and hypotheses.
GBPUSD 15M

Both linear regression channels turned sideways on the 15-minute timeframe, which perfectly reflects the nature of trading in the last two days. If a clear upward trend persists in the long term, then it would be very difficult for the pound/dollar pair to overcome its local highs. Maybe this is the beginning of the end? The end of the upward trend?
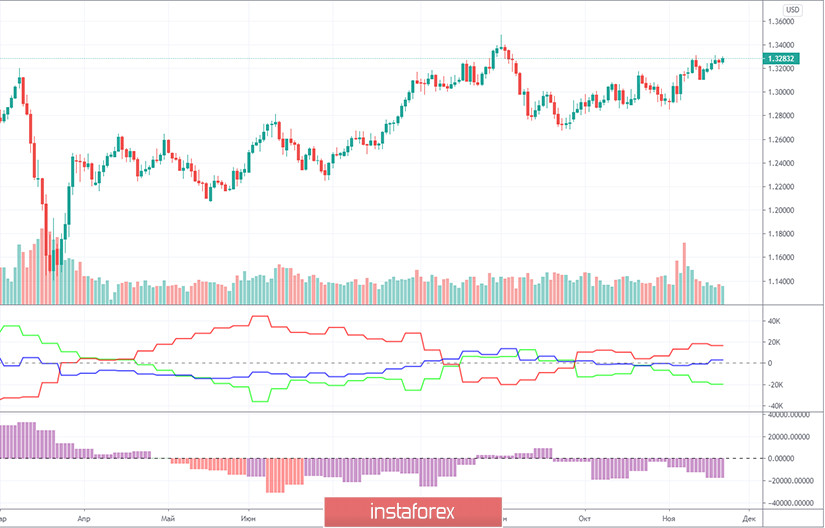
COT report

The GBP/USD pair rose by 25 points in the last reporting week (November 10-16), although the volatility was quite high during this time period. However, the Commitment of Traders (COT) report has not provided us with any important information that could help in forecasting and trading for several weeks now. Recall that the red and green lines must move away from each other or sharply change the direction of their movement, so that we can conclude that one trend ends and another begins. In recent months, both lines regularly change their direction, which indicates the absence of signals based on COT reports. What can we say about the most important group of non-commercial traders? This group opened 533 contracts to buy the pound and 616 contracts to sell during the reporting week. Therefore, it doesn't even make any special sense to calculate the change in the net position or the amount by which the attitude of professional traders has changed. A little more than 1000 contracts per week is very little. Therefore, in essence, there are no changes. What do we end up with? There are no changes, and the general picture of things does not make it possible to predict any definite development of the situation. So now it is better to pay more attention to technique and foundation.
The fundamentals for the British pound were rather weak on Wednesday, considering the news from the UK. In the next article, we will look at all aspects of Britain's fundamental background. It is already obvious that it's negative. In addition to the report on orders for durable goods, America also published reports on GDP for the third quarter, the number of applications for unemployment benefits, as well as changes in personal income and spending of US citizens. The first figure stood at 33.1% q/q, as expected, as published in the previous two estimates. The number of initial applications for benefits was higher than analysts expected, which is not surprising given the scale of the coronavirus pandemic in the United States. The third indicator was insignificant in the current environment. And so the most important reports on GDP and durable goods orders did not support the dollar, but did not also create additional pressure on this currency.
No major events or macroeconomic reports from the UK and the United States for today. The key factor for the pair is also technical. The rising channel keeps traders bullish and that says it all. There is a fairly high probability that Brexit trade talks will fail again this week. At least Michel Barnier warned his colleague David Frost that if there are no concessions, he will withdraw from the negotiations. Will this exit mean that the negotiations will fail completely? It is unlikely that the parties have time for ultimatums to each other and for reflection...
We have two trading ideas for November 26:
1) Buyers for the pound/dollar pair continue to hold the initiative in their hands and did not let the price go below the Kijun-sen line (1.3295) and the rising channel. Thus, we advise you to trade upwards while aiming for the resistance levels of 1.3397 and 1.3483 as long as the price is within the rising channel and above the critical line. Take Profit in this case will be up to 90 points.
2) Sellers failed to go below the critical line yesterday. If the price settles below the Kijun-sen line (1.3295) and below the rising channel, you are advised to sell the pound/dollar pair while aiming for the Senkou Span B line (1.3208). Take Profit in this case can be up to 70 points.
Forecast and trading signals for EUR/USD
Explanations for illustrations:
Support and Resistance Levels are the levels that serve as targets when buying or selling the pair. You can place Take Profit near these levels.
Kijun-sen and Senkou Span B lines are lines of the Ichimoku indicator transferred to the hourly timeframe from the 4-hour one.
Support and resistance areas are areas from which the price has repeatedly rebounded off.
Yellow lines are trend lines, trend channels and any other technical patterns.
Indicator 1 on the COT charts is the size of the net position of each category of traders.
Indicator 2 on the COT charts is the size of the net position for the "non-commercial" group.
 English
 Русский
 Bahasa Indonesia
 Bahasa Malay
 ไทย
ไทย Español
 Deutsch
 Български
 Français
 Tiếng Việt
 中文
中文 বাংলা
বাংলা हिन्दी
 Čeština
 Українська
 Română

