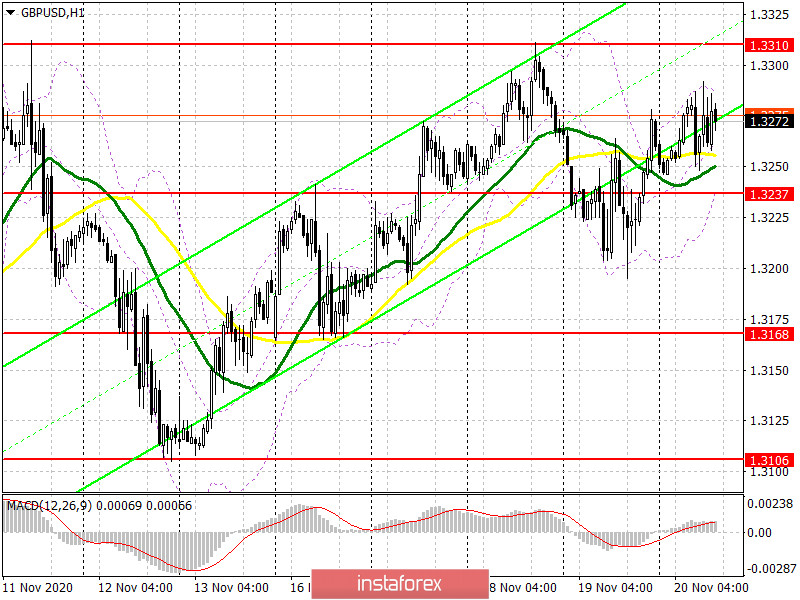
To open long positions on EURUSD, it is required:
By analogy with yesterday, a signal was formed to sell the euro in the first half of the day from the level of 1.1864, however, it did not reach a major downward movement from this area, after which the bears retreated. On the 5-minute chart, you can see how the bears break below the support of 1.1864 and test it from the bottom up, which forms a fairly good signal to sell the euro. However, the lack of important fundamental statistics did not allow the bears to implement their plans. As a result, the technical picture has changed slightly.
The morning level of 1.1864 has now transformed into the resistance of 1.1889, and it is on this level that euro buyers will focus on today in the second half of the day. On the hourly chart, you can see how this area has already been tested several times over the past two days, which is why its breakdown is so important for euro buyers. A breakout and consolidation above 1.1889 form a good signal to open long positions to continue the upward trend, which will lead to an update of the maximum of 1.1953, where I recommend fixing the profits. A further area will be the resistance of 1.2008. If the pressure on the euro returns in the second half of the day, it is best to postpone purchases immediately for a rebound from the large lower border of the side channel of 1.1821, based on a correction of 15-20 points within the day.

To open short positions on EURUSD, you need to:
The bears face a new challenge to defend the resistance of 1.1889. However, only the formation of a false breakout at this level will be a signal to open short positions in the expectation of a decline to the lower border of the side channel 1.1821, where I recommend fixing the profits. Given that important fundamental statistics are not released this afternoon, it is unlikely that the pair's volatility will go beyond these ranges. In the scenario of a breakout and consolidation below 1.1821, we can expect the pair to continue to decline to the support of 1.1762, which will form a new downward trend for the pair. If there is no bear activity at 1.1889 in the second half of the day, I recommend that you stop selling before updating the maximum of 1.1953, where you can open short positions immediately for a rebound based on a downward correction of 15-20 points within the day.
The COT report (Commitment of Traders) for November 10 recorded a reduction in long and short positions. Euro bulls are holding a wait-and-see attitude and are in no hurry to return to the market even after the presidential election in the United States. But despite this, buyers of risky assets believe in the continuation of the bull market, although they prefer to act cautiously. Thus, long non-commercial positions decreased from the level of 208,237 to the level of 202,374, while short non-commercial positions remained almost unchanged, falling from the level of 67,888 to 67,087. The total non-profit net position fell to 135,287, down from 140,349 a week earlier. It is worth noting that the delta has been declining for 7 consecutive weeks, which confirms the lack of desire of euro buyers to go to the market in the current conditions. Growth will begin only after Joe Biden's victory and his intentions to give the American economy the next largest monetary aid package for more than $ 2 trillion begin to be realized.
Signals of indicators:
Moving averages
Trade in the area of moving averages, which indicates the sideways nature of the market.
Note: The period and prices of moving averages are considered by the author on the hourly chart H1 and differ from the general definition of classic daily moving averages on the daily chart D1.
Bollinger Bands
A break in the upper limit of the indicator around 1.1889 will lead to a new wave of euro growth. A break of the lower limit of the indicator in the area of 1.1855 will increase the pressure on the pair.
Description of indicators
- Moving average (moving average determines the current trend by smoothing out volatility and noise). Period 50. The graph is marked in yellow.
- Moving average (moving average determines the current trend by smoothing out volatility and noise). Period 30. The graph is marked in green.
- MACD indicator (Moving Average Convergence / Divergence - moving average convergence / divergence) Fast EMA period 12. Slow EMA period 26. SMA period 9
- Bollinger Bands (Bollinger Bands). Period 20
- Non-profit speculative traders, such as individual traders, hedge funds, and large institutions that use the futures market for speculative purposes and meet certain requirements.
- Long non-commercial positions represent the total long open position of non-commercial traders.
- Short non-commercial positions represent the total short open position of non-commercial traders.
- Total non-commercial net position is the difference between the short and long positions of non-commercial traders.
 English
 Русский
 Bahasa Indonesia
 Bahasa Malay
 ไทย
ไทย Español
 Deutsch
 Български
 Français
 Tiếng Việt
 中文
中文 বাংলা
বাংলা हिन्दी
 Čeština
 Українська
 Română

