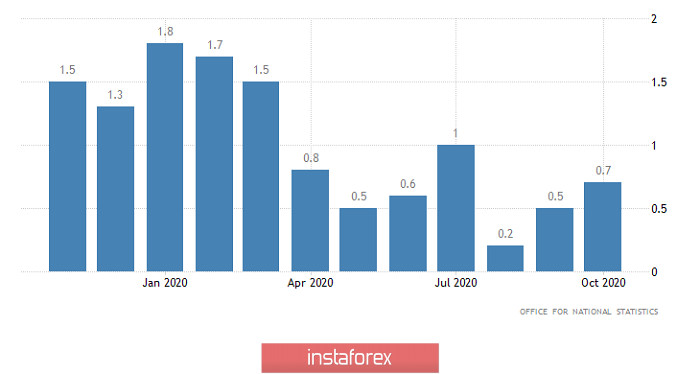
The market has literally been standing still for almost a week now. There is practically no activity, and the scale of changes in quotes have been purely symbolic. And these changes are happening rather slowly. This is despite the fact that inflation data was published in the UK yesterday, which showed growth from 0.5% to 0.7%. Even before the outbreak of the pandemic and the onset of political confusion in the United States, the publication of such data would lead to an explosive growth in the pound. But yesterday the pound did not grow, but fell in price instead. And even then, only by 70 points. In this case, not all at once, but throughout the trading day. So the market stagnation continues. But it is noteworthy that the pound fell in price. This clearly shows that, in principle, it has nowhere to grow, and all its previous growth was largely due to exclusively political and, in particular, emotional factors. Therefore, its growth potential is extremely limited. But there are no reasons for it to fall either.
Inflation (UK):

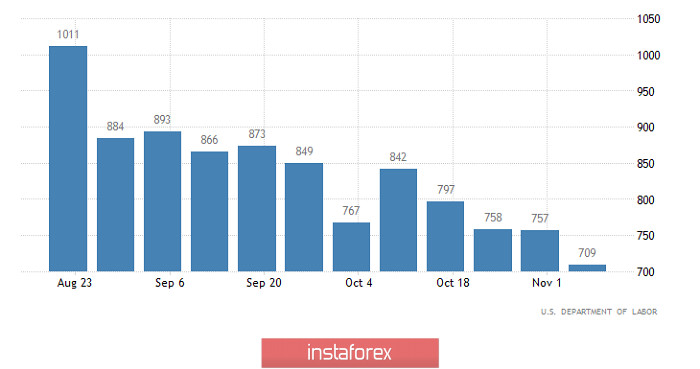
Likewise, there won't be any serious reaction to today's US unemployment claims report. Most likely, we will see further sluggish weakening of the pound. After all, the number of initial applications should decrease from 709,000 to 685,000. The number of repeated applications may decrease from 6,786,000 to 6,250,000. So there is clearly a reason for strengthening the dollar. But even before, there were enough similar reasons, and the market practically did not react in any way. So the weakening of the pound will be purely symbolic.
Number of initial claims for unemployment benefits (United States):

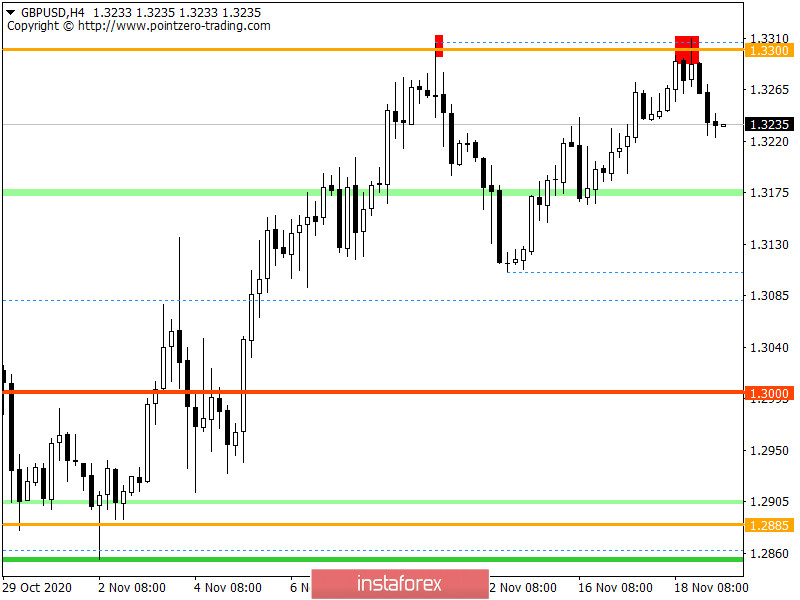
The GBPUSD pair, moving along an upward trajectory, reached the resistance level of 1.3300, where there has been a stop on a regular basis, followed by a rebound in the opposite direction.
Based on the quote's current location, we can see that the pullback process returned market participants to the 1.3220 area, which is about 40% of recovery relative to the upward trend.
As for volatility, there is a process of slowing down the dynamics, which lasted for four trading days.
Looking at the trading chart in general terms, the daily period, you can see that the 1.3300 level became an obstacle to updating the main high of 1.3480. The medium-term trend, as before, remains upward.
We can assume that if the price stays below 1.3220, further downward movement towards 1.3175-1.3110 is not excluded. The alternative scenario considers price bumps in the 1.3220/1.3300 range.
From the point of view of complex indicator analysis, we see that the indicators of technical instruments on the minute and hourly intervals signal a sale due to the downward movement in the period of the previous day. The daily period is focused on an upward move, signaling a buy.

 English
 Русский
 Bahasa Indonesia
 Bahasa Malay
 ไทย
ไทย Español
 Deutsch
 Български
 Français
 Tiếng Việt
 中文
中文 বাংলা
বাংলা हिन्दी
 Čeština
 Українська
 Română

