For centuries, gold has been perceived as a reliable asset that is best kept in the face of global turmoil. Including in the global economy and financial markets. In this regard, the XAUUSD rally to record highs due to the pandemic and recession looks logical, but let's not forget that before soaring above $2000 per ounce, the precious metal sank significantly along with US stocks. Then, as the S&P 500 recovered, the correlation between these assets grew, which, at first glance, should be surprising. The stock index is a risky instrument, gold is a safe haven, can they go in the same direction?
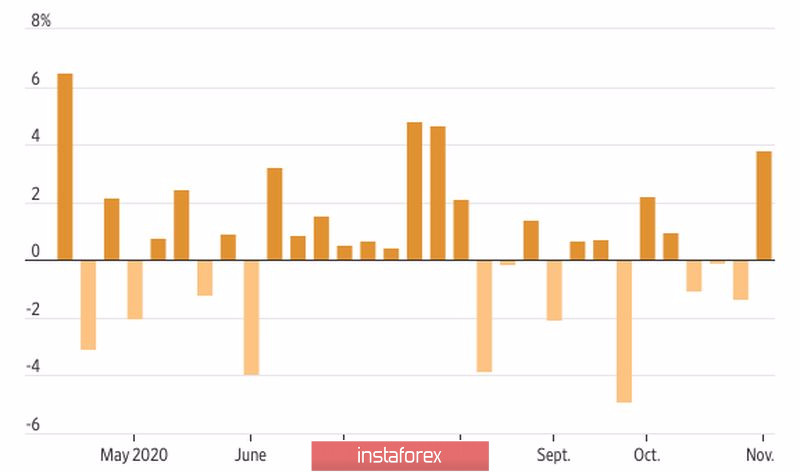
Weekly gold dynamics:

When there is a lot of money in the system, investors have a desire to buy profitable assets and at the same time insure the risks of their decline with the help of reliable ones. Something went wrong - we partially get rid of the S&P 500, and use the sale of precious metals to maintain the remaining longs on shares, as it was in March.
Thus, large-scale incentives have become a catalyst for the rally of both US stock indexes and XAUUSD quotes. Moreover, the expectations of the "blue wave" allowed us to talk about a reflationary background that could support not only stocks but also precious metals. Unfortunately, Republicans are likely to retain control of the Senate and strengthen their position in the House of Representatives. Moreover, the good news about vaccines is an argument that an additional massive fiscal stimulus is not needed. As a result, investors risk facing the same story as in 2011, when they expected acceleration in inflation, but when it did not happen they began to sell gold.
The collapse of more than 5% of XAUUSD in trading on November 9 was made possible by a rapid rally in the yield of 10-year US Treasury bonds in the direction of 1%. The debt market is setting expectations for a recovery in the US economy, which will allow the Fed to raise the Federal funds rate earlier than currently expected.
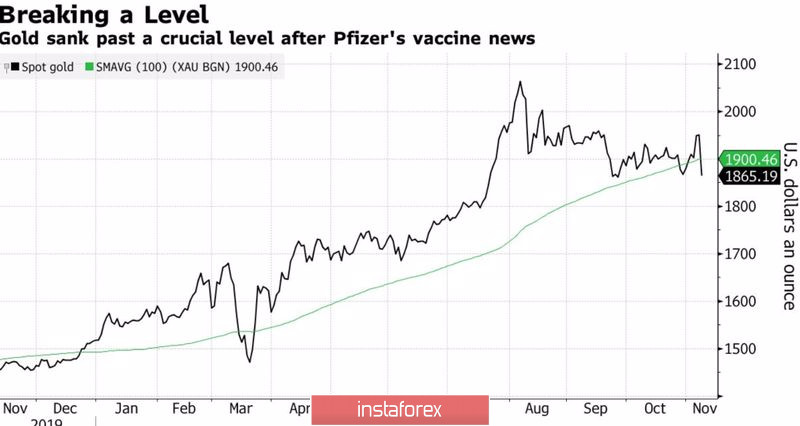
Not the least role in the fall of the precious metal was played by a technical factor (quotes collapsed below the 100-day moving average), as well as the US dollar rising from the ashes.
Gold Breakout Dynamic Support:

Many believed that Joe Biden's victory in the presidential election would weaken the US dollar due to the growth of the double deficit. However, the bears on the USD index did not take into account the dollar smile theory. Usually, growth is initially observed due to increased demand for safe-haven assets during a recession, then falls against the backdrop of aggressive monetary expansion by the Fed, and finally strengthens again due to the outperforming dynamics of US GDP over its global counterparts. The second wave of COVID-19 in Europe will contribute to the EURUSD correction.
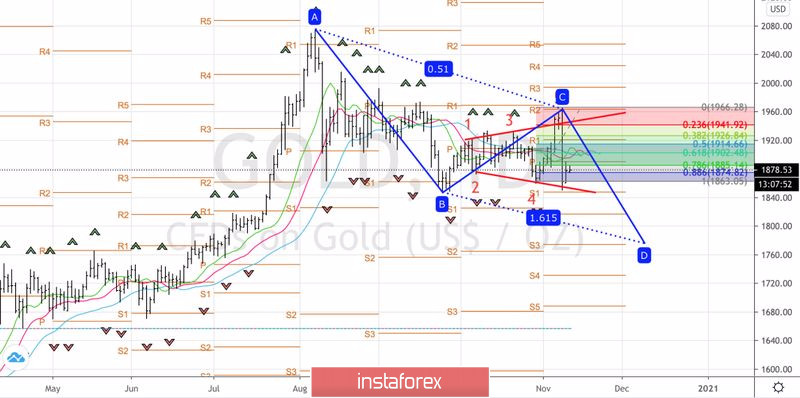
Technically, the Broadening Wedge pattern was formed and clearly played out on the daily gold chart. A break of 78.6% and 88.6% support from wave 4-5 indicates that the situation is under the control of the bears. At the same time, successful tests of the $1860 and $1845 per ounce level will allow you to open shorts and will help activate the AB=CD model with a target of 161.8%. It corresponds to the $1,775 mark.
Gold, daily chart:

 English
 Русский
 Bahasa Indonesia
 Bahasa Malay
 ไทย
ไทย Español
 Deutsch
 Български
 Français
 Tiếng Việt
 中文
中文 বাংলা
বাংলা हिन्दी
 Čeština
 Українська
 Română

