EUR/USD
Analysis:
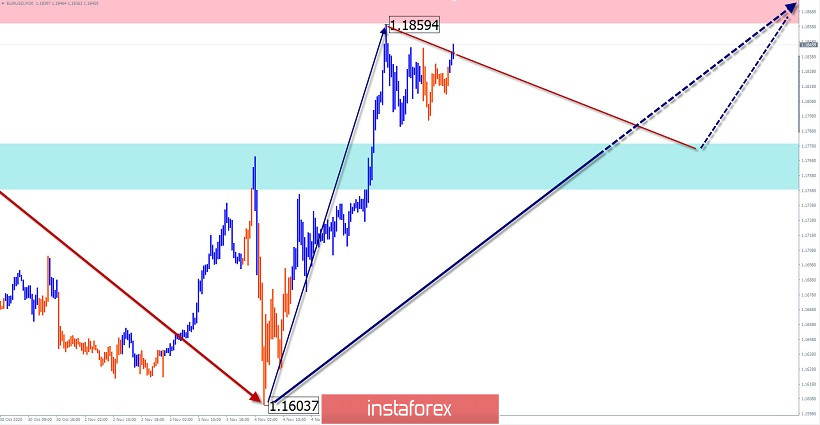
The fluctuations of the last two days put an end to the wave marking on the chart of the European currency. The price growth that started the day before yesterday has a much higher wave level than the previous movements. The final part (C) of the main wave started in this section. There has been a rollback in its framework.
Forecast:
An intermediate correction is expected to form between the nearest zones in the next 24 hours. By the end of the day, you can expect the resumption of the upward movement mood. A breakout of the resistance zone is unlikely today.
Potential reversal zones
Resistance:
- 1.1860/1.1890
Support:
- 1.1780/1.1750
Recommendations:
There are no conditions for sales today. It is recommended to refrain from entering the euro market during the price pullback and look for signals to buy the instrument in the area of the support zone.

GBP/JPY
Analysis:
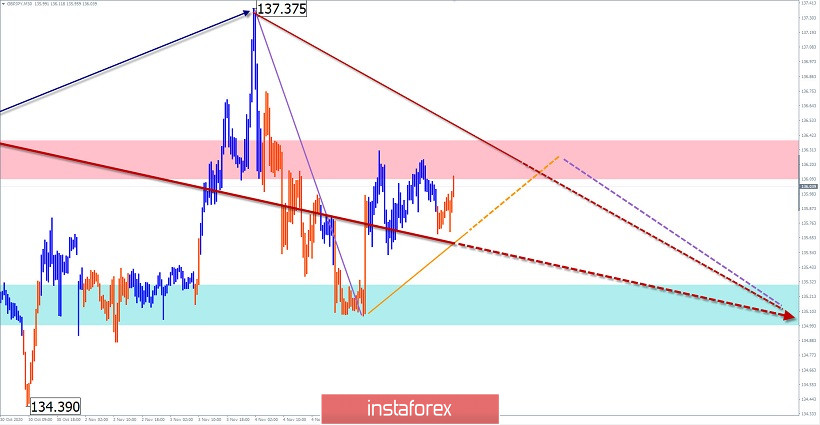
There is a sideways trend on the medium-term scale of the cross chart. In the incomplete bearish wave of October 12, the intermediate correction part (B) was completed. Since November 4, the testamentary part of the wave (C) has been developing. It creates a price pullback.
Forecast:
In the next trading sessions, after attempts to put pressure on the resistance zone, the exchange rate is expected to change and the price will move down. A breakout of the support zone cannot be ruled out today.
Potential reversal zones
Resistance:
- 136.10/136.40
Support:
- 135.30/135.00
Recommendations:
There are no conditions for cross purchases today. It is recommended to track all emerging signals for selling the instrument.

Explanation: In the simplified wave analysis (UVA), waves consist of 3 parts (A-B-C). The last incomplete wave is analyzed. The solid background of the arrows shows the formed structure, and the dotted one shows the expected movements.
Note: The wave algorithm does not take into account the duration of the instrument's movements in time!
 English
 Русский
 Bahasa Indonesia
 Bahasa Malay
 ไทย
ไทย Español
 Deutsch
 Български
 Français
 Tiếng Việt
 中文
中文 বাংলা
বাংলা हिन्दी
 Čeština
 Українська
 Română

