The Pound demonstrates an excellent technique
Good day, dear traders!
Daily

Despite yesterday's decline, the technical picture for the pound/dollar currency pair is very very interesting. This pair still demonstrates excellent technique and provides traders with good signals to open trades. However, before we delve into technical analysis, we will outline the main fundamental events of today. In today's economic calendar, a number of important reports are planned that will come from the United States of America. So, at 12:30 UTC, the traditional weekly data on the number of initial applications for unemployment benefits will be released, the price deflator will be published, and the States will also publish preliminary data on GDP for the third quarter. The report on pending housing sales will end at 14:00 UTC. You should also pay attention to today's press conference of the President of the European Central Bank (ECB) Christine Lagarde. It is quite possible that the growth or fall of the single European currency will also affect the price dynamics of the British pound. This has happened more than once.
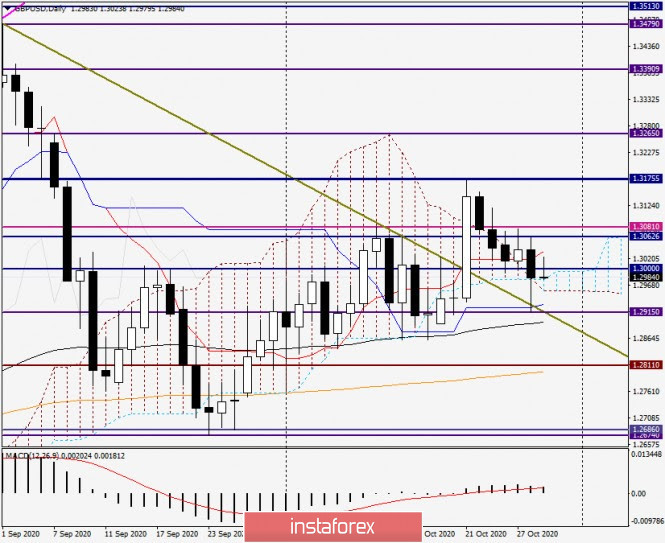
The pair reached the designated goals and gave a pullback to the broken resistance line of 1.3479 to 1.3063 relative to yesterday's decline in GBP/USD. As expected, this line together with the Kijun line of the Ichimoku indicator provided strong support to the quote and provoked a good rebound up. As a result, despite the closing of yesterday's session below the important psychological and technical level of 1.3000, yesterday's candle formed a long lower shadow which leaves room for further growth of the pair.
In today's trading, the pound bulls are trying to return the rate above 1.3000. Highs were already shown at 1.3024 but the quote started to decline from this mark. It is likely that the red Tenkan line of the Ichimoku indicator, which runs at 1.3034 played an important role as resistance. If the players on the increase manage to complete today's trading above the Tenkan, the road will open to the next resistance zone 1.3062 up to 1.3081, where the maximum values of yesterday's trading were shown and the false broken resistance level 1.3081 is also located. The task is quite complex but it is quite feasible. Much will depend on market sentiment and the events outlined above.
Bears on the pound/dollar pair need to lower the quote below the blue Kijun line. Yesterday's minimum value is at 1.2915 and then tests the significant level of 1.2900 and the black 89 exponential moving average, which is slightly below this mark.
Hourly Time frame

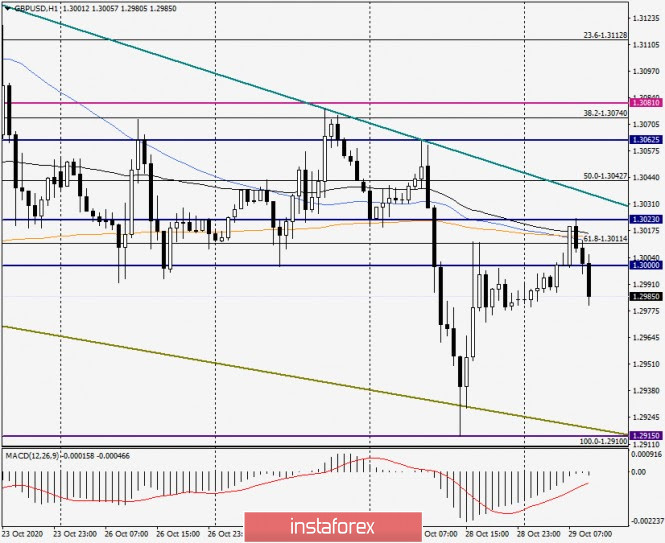
Looking at the hourly chart, it is worth noting that the pair is trading below the used moving averages (50 MA, 200 EMA and 89 EMA), each of which can provide quite strong resistance to growth attempts. Taking into account that the resistance line 1.3175 - 1.3078 passes slightly higher, the zone for potential sales can be designated as 1.3012-1.3034. If the moves and the resistance line are broken, then the rollback to the price zone 1.3035 - 1.3030 should already be considered opening buy deals. I also recommend taking a closer look at opening long positions and at lower prices, if the GBP/USD falls into the support zone of 1.2925 - 1.2915 and bullish patterns of Japanese candles appear there.
Successful and profitable transactions!
 English
 Русский
 Bahasa Indonesia
 Bahasa Malay
 ไทย
ไทย Español
 Deutsch
 Български
 Français
 Tiếng Việt
 中文
中文 বাংলা
বাংলা हिन्दी
 Čeština
 Українська
 Română

