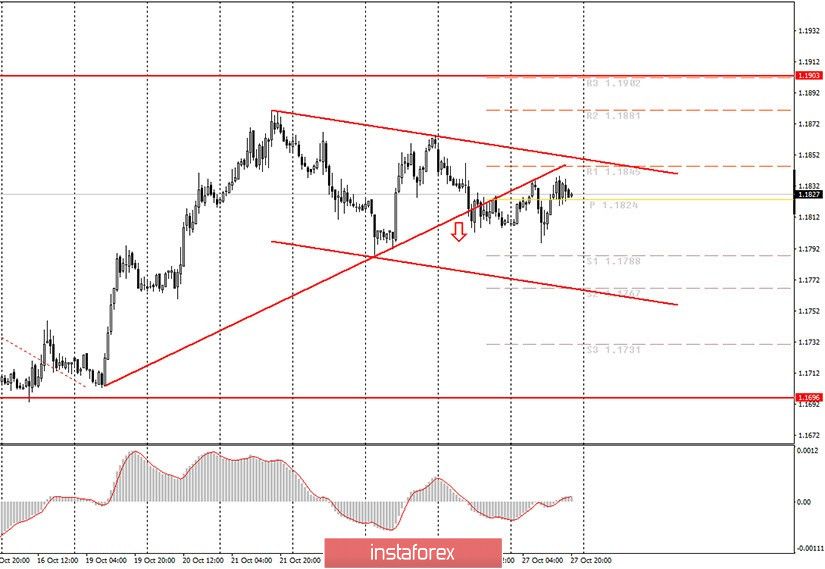
Hourly chart of the EUR/USD pair

The EUR/USD pair, after overcoming the upward trend line, could not continue the downward movement it started on Tuesday, October 27. The MACD indicator generated a sell signal during the day, which, unfortunately, turned out to be false. Novice traders could have lost up to 18 points. As we have said many times in recent days, the pair's movements are now extremely complex. In fact, we now see a flat within a flat. After all, the pair continues to trade between the levels of 1.1700 and 1.1900 for the third consecutive month, that is, in a horizontal channel. And in recent days, another horizontal channel, 50 points wide, was formed, in which all trades take place. In addition to this (!!!), another downward trend channel was formed, shown in the graph, which supports those who trade for a fall, but at the same time it is directed more sideways than down. Thus, wherever we look, we can state more lateral movement than downward movement. You can formally consider short positions in the upper area of the new descending channel, expecting a downward movement to the lower border. However, we warn novice traders that almost any position now is associated with increased risks.
The European Union did not publish a single macroeconomic report on Tuesday, but the United States released one on orders for durable goods. We said this morning and yesterday as well that this report is important enough, but we warned that it is unlikely that any market reaction will follow. And so it happened in practice. If there was a reaction, it was absolutely minimal, since the report turned out better than the experts' forecasts, respectively, the US dollar should have gone up in the second half of the day, which, in fact, did not happen.
No important publications in the European Union or the United States on Wednesday. No major events or speeches either. Thus, a weakly volatile movement can continue, which is absolutely not in the hands of traders. Accordingly, market participants can only rely on any unexpected and unplanned news, which also simply may not exist. Recall that the number one topic in the European Union is the coronavirus, the second wave of which continues to gain momentum. In the long term, this threatens serious problems for the European economy, but so far no actual deterioration or decline in the economy has been recorded, so traders do not panic ahead of time. The number one topic in America is still the presidential elections, which have already begun, as more than 60 million Americans have already voted. Thus, the markets continue to be very worried about the outlook for the US economy and are also waiting. They are waiting for the results of the elections, which will end on November 3.
Possible scenarios for October 28:
1) Buy positions on the EUR/USD pair are currently irrelevant, since the rising trend line has been overcome, and the price is currently trading within the descending channel. Thus, you can consider long positions, but first the price should settle above the descending channel, and even then, you have to be very careful, with targets of 1.1881 and 1.1902.
2) Trading for a fall at this time is more relevant, since the price is inside the descending channel. Therefore, novice traders are advised to wait for a new sell signal from the MACD and trade down with the targets of 1.1788 and 1.1767. If this signal is also quickly canceled and the downward movement does not continue, then you are advised to leave the market until the next recommendations.
On the chart:
Support and Resistance Levels are the Levels that serve as targets when buying or selling the pair. You can place Take Profit near these levels.
Red lines are the channels or trend lines that display the current trend and show in which direction it is better to trade now.
Up/down arrows show where you should sell or buy after reaching or breaking through particular levels.
The MACD indicator (14,22,3) consists of a histogram and a signal line. When they cross, this is a signal to enter the market. It is recommended to use this indicator in combination with trend lines (channels and trend lines).
Important announcements and economic reports that you can always find in the news calendar can seriously influence the trajectory of a currency pair. Therefore, at the time of their release, we recommended trading as carefully as possible or exit the market in order to avoid a sharp price reversal.
Beginners on Forex should remember that not every single trade has to be profitable. The development of a clear strategy and money management are the key to success in trading over a long period of time.
 English
 Русский
 Bahasa Indonesia
 Bahasa Malay
 ไทย
ไทย Español
 Deutsch
 Български
 Français
 Tiếng Việt
 中文
中文 বাংলা
বাংলা हिन्दी
 Čeština
 Українська
 Română

