Yesterday, the mood of market participants continued to be influenced by information about the adoption of a new package of fiscal incentives in the United States. I must admit that the data has been quite controversial. According to one report, the current President of the United States, Donald Trump, promised to allocate over $ 2.2 trillion as part of a new package of assistance from COVID-19. According to other information, the previously proposed volume of incentives in the amount of 1.8 trillion will increase by only $ 80 billion. It should be noted here that for the most democratic country in the world, such election tinsel is quite common. Each of the warring parties does not disdain any methods. Both Biden and Trump have already made it clear that they will not recognize the results of the vote if they are not in their favor. Trump's situation is very difficult, he is lagging behind Biden and is unlikely to be able to reduce this gap, and the incentive program must be adopted as soon as possible. In Europe, the second wave of the COVID-19 pandemic is already in full swing, which is likely to cover the United States in a couple of weeks. In this situation, Biden again has the advantage, because the Republicans and their leader have no choice but to make concessions to the Democrats and allocate a more impressive aid package.
From yesterday's events, it is also worth noting the publication of the Fed's Beige Book, which notes that economic growth is gradually gaining momentum and in general it can be considered moderate. But employment, according to Fed officials, is still growing at a slow pace.
Daily

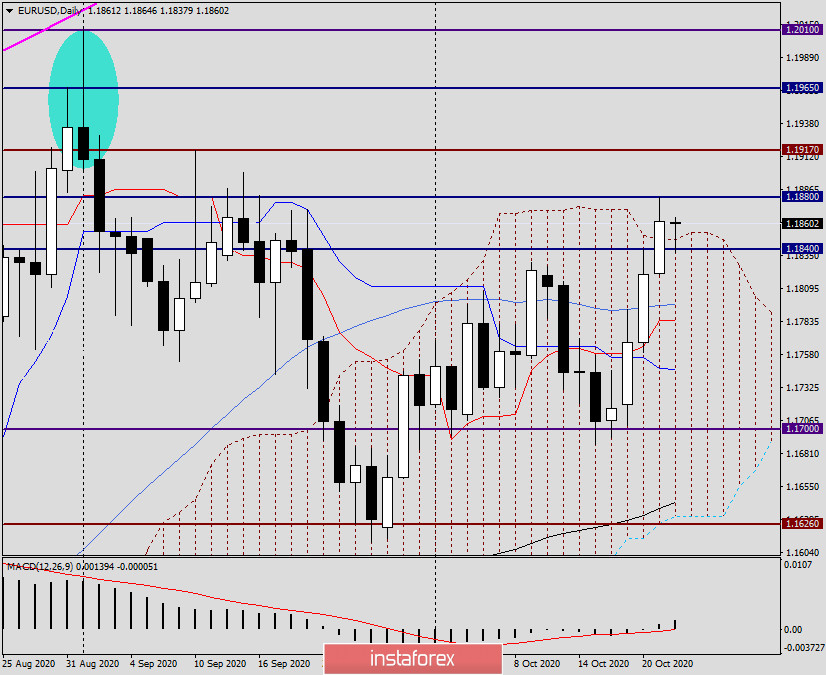
In yesterday's trading session, the main pair has shown impressive growth, reaching the level of 1.1880. However, the quote failed to stay close to the reached highs. There was a small pullback and Wednesday's trading ended at 1.1861. Given that the pair came out of the Ichimoku indicator cloud and closed trading above the important technical level of 1.1860, this can be considered a local victory for the euro bulls. However, now they need to keep the price above the cloud, update yesterday's highs, and then storm the very strong technical area of 1.1900-1.1917 for a breakdown. After its breakdown, they will be able to accept congratulations on the fact that they control the market for EUR/USD.
In the meantime, the bears are not going to give up. This can be seen from their attempts to return the price to the limits of the daily cloud. From a technical point of view, there was a pullback to the broken upper border of the cloud and an opportunity was given to open purchases. I will assume that this possibility remains relevant since at the moment the pair has also rolled back to the resistance level of 1.1840 that was broken the day before. A very important day and its closing price for EUR/USD!
H4

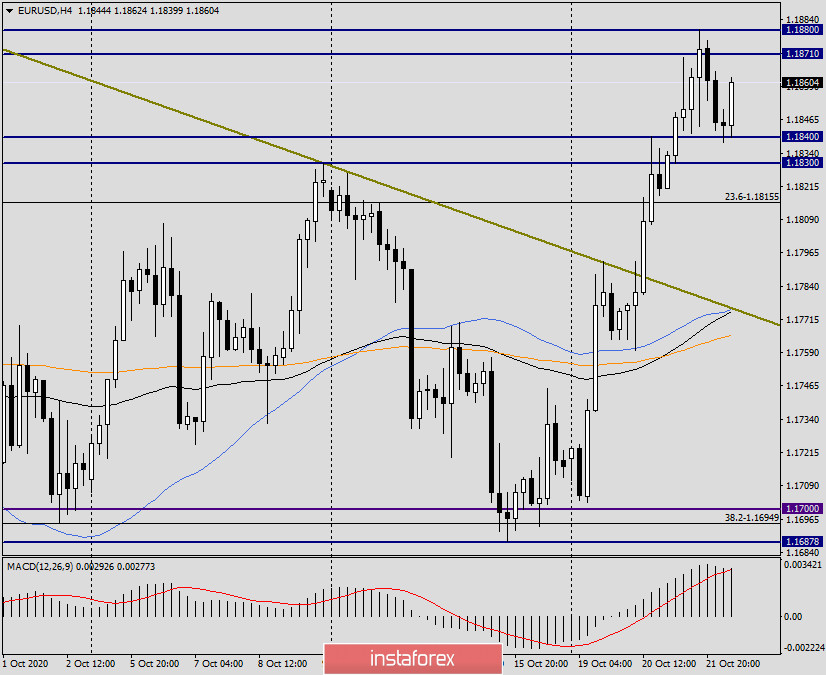
On this chart, the pullback to the broken resistance of 1.1840 is even more visible, however, there is another such broken resistance at 1.1830. Thus, we will consider 1.1845-1.1830 as a zone for purchases (taking into account the spread). If the pair goes below 1.1830 and fixes below this level, there will be big questions about the truth of yesterday's growth, which resulted in an upward exit from the daily cloud of the Ichimoku indicator.
For trading ideas, I suggest buying aggressively and riskily now. As you can see, there has already been a pullback to the broken resistance, and at the end of this article, the pair is trying to push off from 1.1840 once again and resume the ascent. You could try to buy on the breakout of yesterday's highs of 1.1880, however, the next possible resistance at 1.1900 and 1.1917 are very close. In general, everything is very close and the situation is not easy.
For sales that seem less relevant in the light of the current strengthening of the euro/dollar, it is necessary to wait for bearish candlestick analysis models in the price zone of 1.1870-1.1880 or the area of 1.1900-1.1917 and only then open deals for sale.
 English
 Русский
 Bahasa Indonesia
 Bahasa Malay
 ไทย
ไทย Español
 Deutsch
 Български
 Français
 Tiếng Việt
 中文
中文 বাংলা
বাংলা हिन्दी
 Čeština
 Українська
 Română

