Technical outlook:
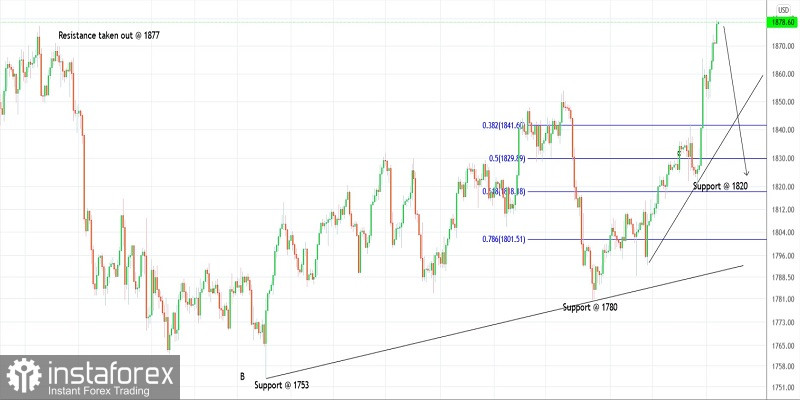
Gold prices are trading at a 12-week high around $1,880 on Tuesday at the time of writing. The yellow metal has taken out resistance at $1,877 with ease but the RSI on hourly chart (not shown here) is indicating a strong bearish divergence. High probability remains for a turn lower toward $1,840 and $1,820 levels in the near term.
Gold wave structure has changed as bulls have taken out $1,877 interim resistance. The primary boundary is now between $1,753 and $1,853, which was retraced to $1,780 on January 28, 2022. The Fibonacci extensions for the above upswing are pointing towards $1,890 and $1,914 levels respectively (not seen on the 4H chart presented here).
It remains to be seen if Gold prices continue to rally from here to the above targets or after producing a pullback. Intraday and short term fibonacci support levels are seen around $1,740 and $1,720, which are the 0.382 and 0.618 retrwcements. Aggressive traders might be preparing to initiate fresh short positions around current levels.
Trading plan:
Aggressive: Potential drop to $1,840-20 against $1,916
Conservative: Remain flat and allow the correction to complete.
Good luck!
 English
 Русский
 Bahasa Indonesia
 Bahasa Malay
 ไทย
ไทย Español
 Deutsch
 Български
 Français
 Tiếng Việt
 中文
中文 বাংলা
বাংলা हिन्दी
 Čeština
 Українська
 Română

