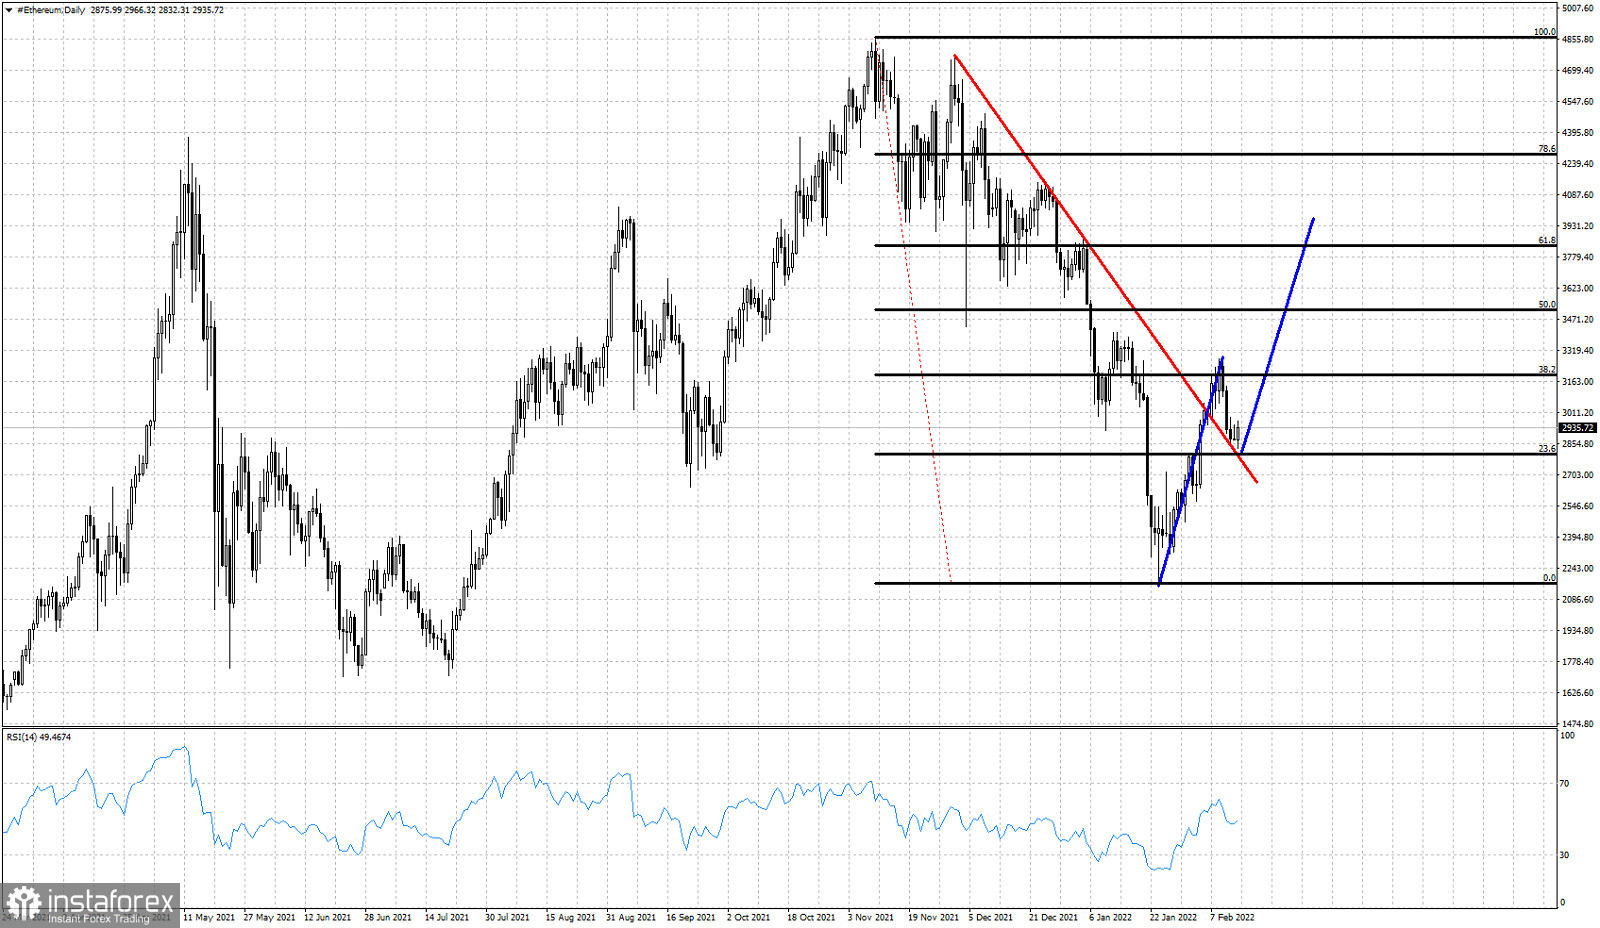
Ethereum after reaching as high as $3,285, has pulled back towards $2,830. Price initially broke out and above the downward sloping trend line resistance and reached the 38% Fibonacci retracement of the entire decline. Now price it testing the broken trend line from above. Previous resistance is now support.

Black lines -Fibonacci retracements
Blue lines -expected equal leg higher
Ethereum ideally will bounce off the red trend line as it tests it from above. Price can start a second upward leg towards the 61.8% Fibonacci retracement which is key Fibonacci resistance. We continue to expect that the decline from its all time highs has been completed and that Ethereum is at least making a counter trend move higher. This bounce is expected to reach the 61.8% retracement level or a little bit higher, in order to make a second up leg similar in size to the first bounce.
 English
 Русский
 Bahasa Indonesia
 Bahasa Malay
 ไทย
ไทย Español
 Deutsch
 Български
 Français
 Tiếng Việt
 中文
中文 বাংলা
বাংলা हिन्दी
 Čeština
 Українська
 Română

