To open long positions on GBP/USD, you need:
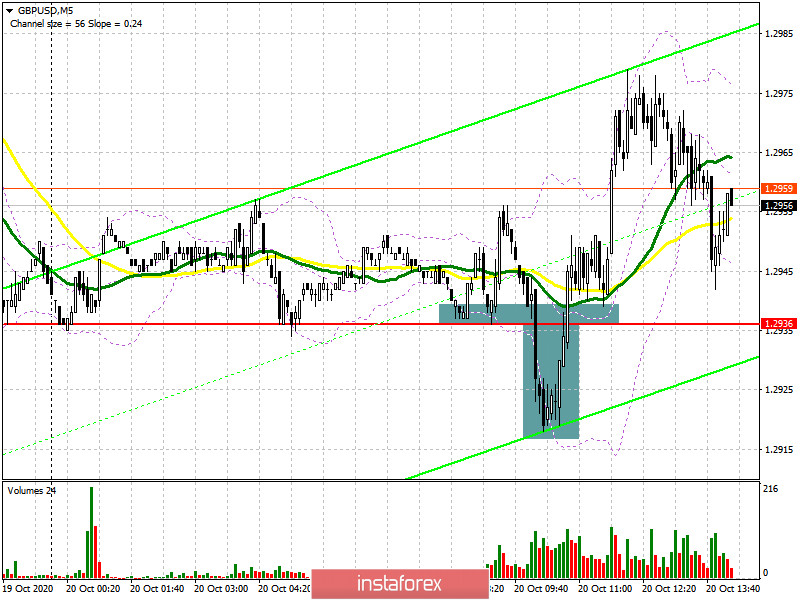
In my morning forecast, I paid attention to purchases after a false breakout from the level of 1.2936 in the continuation of the upward trend. However, before analyzing this signal, it is worth noting the bears' attempt to return to the market, which is especially visible on the 5-minute chart. It can be seen that after the breakout and consolidation below the level of 1.2936, the test on the reverse side of this range formed a good entry point into short positions, however, this did not lead to anything good. As a result, after the bulls returned to the level of 1.2936, it was possible and necessary to open long positions in the continuation of the pound's strengthening. The growth was more than 40 points, after which the market stopped.

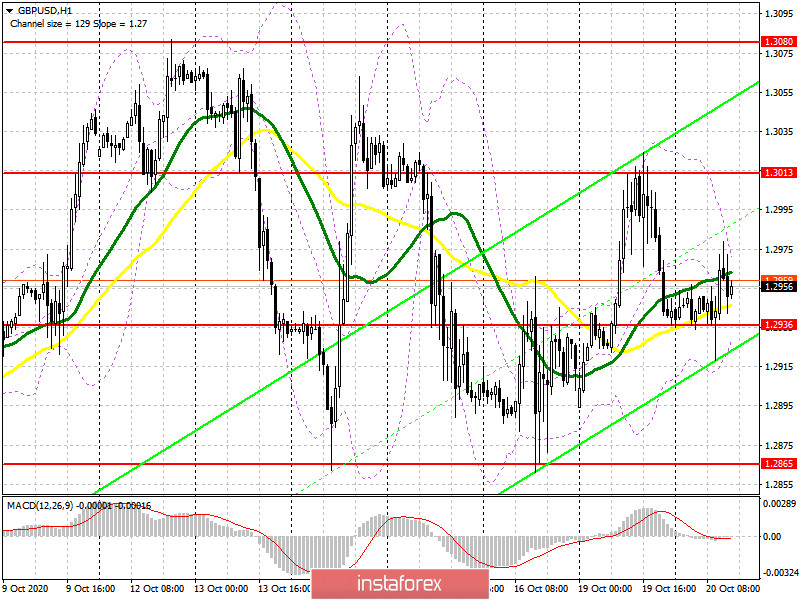
From a technical point of view, nothing has changed, as the price returned to the area of the opening level of the day. The hourly chart shows how trading is again conducted in the area of the 1.2936 range and the bulls will have to make a lot of effort to achieve another false breakout at this level, which will be a signal to open long positions in the pair, similar to the morning purchase. In this case, the goal will be to return to the upper border of the side channel 1.3013, which also acts as yesterday's maximum. Only its breakout will resume the bull market and open a direct road to the 1.3080 area, where I recommend taking the profits. If there is no activity in the second half of the day at the level of 1.2936, it is best not to rush to buy, since important fundamental statistics are not published today, and there is no special reason for the pound to grow. In this case, the nearest support level will be the lower border of the side channel 1.2865, from which you can buy the pound immediately for a rebound in the expectation of correction of 20-30 points within the day.
To open short positions on GBP/USD, you need:
Sellers clearly do not intend to give up the market and the entire focus today in the second half of the day will again be shifted to the support of 1.2936. Another consolidation below this range forms a good entry point into short positions in the expectation of a return of the pound to the lower border of the side channel 1.2865, where I recommend fixing the profits. Only going beyond it will lead to the formation of a bearish trend that can push the pound to the lows of 1.2807 and 1.2749. If the bulls manage to seize the initiative, then it is better not to rush with sales. The most optimal scenario for opening short positions is the formation of a false breakout near the upper border of the 1.3013 side channel. I recommend selling GBP/USD immediately for a rebound only after testing a new high of 1.3080, based on a correction of 20-30 points within the day.

Let me remind you that in the COT reports (Commitment of Traders) for October 13, there was a reduction in both long and short non-commercial positions. Long non-commercial positions decreased from level 40,698 to 36,195. At the same time, short non-commercial positions fell more significantly from the level of 51,996 to the level of 45,997. As a result, the negative value of the non-commercial net position slightly increased to -9,802 against -11,298 a week earlier, which indicates that sellers of the British pound remain in control and have a minimal advantage in the current situation.
Signals of indicators:
Moving averages
Trading is conducted around 30 and 50 daily averages, which indicates the sideways nature of the market.
Note: The period and prices of moving averages are considered by the author on the hourly chart H1 and differ from the general definition of the classic daily moving averages on the daily chart D1.
Bollinger Bands
A break of the lower limit of the indicator in the area of 1.2930 will lead to a larger sell-off of the pound.
Description of indicators
- Moving average (moving average determines the current trend by smoothing out volatility and noise). Period 50. The graph is marked in yellow.
- Moving average (moving average determines the current trend by smoothing out volatility and noise). Period 30. The graph is marked in green.
- MACD indicator (Moving Average Convergence / Divergence - moving average convergence / divergence) Fast EMA period 12. Slow EMA period 26. SMA period 9
- Bollinger Bands (Bollinger Bands). Period 20
- Non-profit speculative traders, such as individual traders, hedge funds, and large institutions that use the futures market for speculative purposes and meet certain requirements.
- Long non-commercial positions represent the total long open position of non-commercial traders.
- Short non-commercial positions represent the total short open position of non-commercial traders.
- Total non-commercial net position is the difference between the short and long positions of non-commercial traders.
 English
 Русский
 Bahasa Indonesia
 Bahasa Malay
 ไทย
ไทย Español
 Deutsch
 Български
 Français
 Tiếng Việt
 中文
中文 বাংলা
বাংলা हिन्दी
 Čeština
 Українська
 Română

