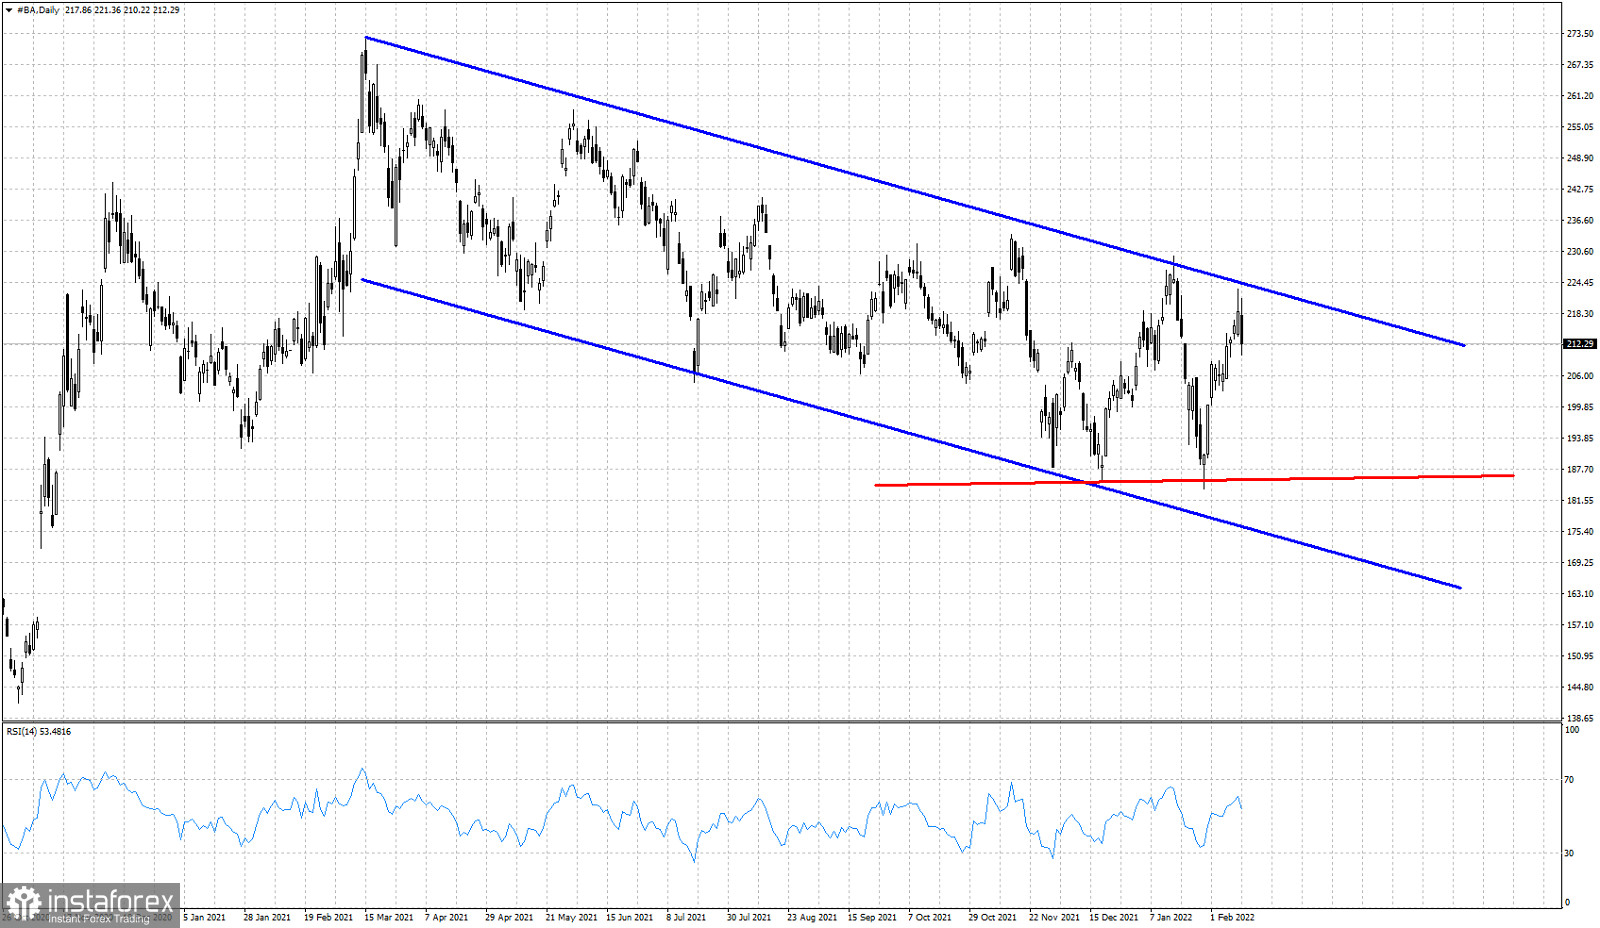
In our last analysis on BA stock price we noted that price was challenging the important resistance of the bearish channel at the $224 price area. On Friday's trading session price got rejected and turned lower towards $212.

Blue lines- bearish channel
BA stock price is inside the medium-term bearish channel since March of 2021. So far price is forming lower highs and lower lows. Last week we saw another lower high being formed right at the upper boundary of the bearish channel. The chances favor a turn lower. In order to confirm a trend change, we should see price move above and out of the bearish channel it is in for the last 12 months. Aggressive traders will prefer to be bearish at current levels and as long as price is below $225, targeting the red horizontal support level at $185.
 English
 Русский
 Bahasa Indonesia
 Bahasa Malay
 ไทย
ไทย Español
 Deutsch
 Български
 Français
 Tiếng Việt
 中文
中文 বাংলা
বাংলা हिन्दी
 Čeština
 Українська
 Română

