To open long positions on GBP/USD, you need:
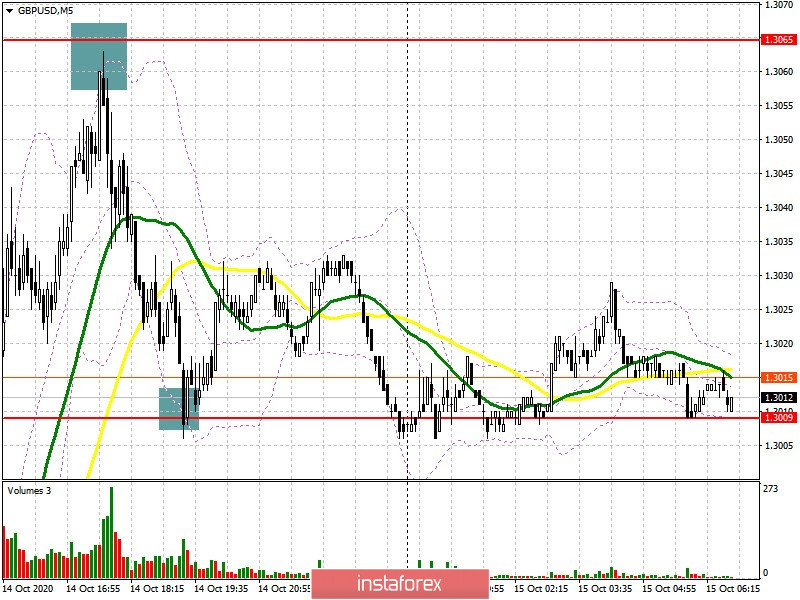
There was an excellent entry point to sell the pound from the 1.3065 level yesterday afternoon, because after the first breakout of resistance at 1.3009, it was not possible to wait for it to be tested from the reverse side. Let's take a look at the 5-minute chart. The bulls began to take profits after testing resistance at 1.3065, which caused the pound to immediately fall to the support area of 1.3009, where it was then possible and necessary to open long positions in anticipation of another wave of the pound's growth. However, there was no major upward movement.

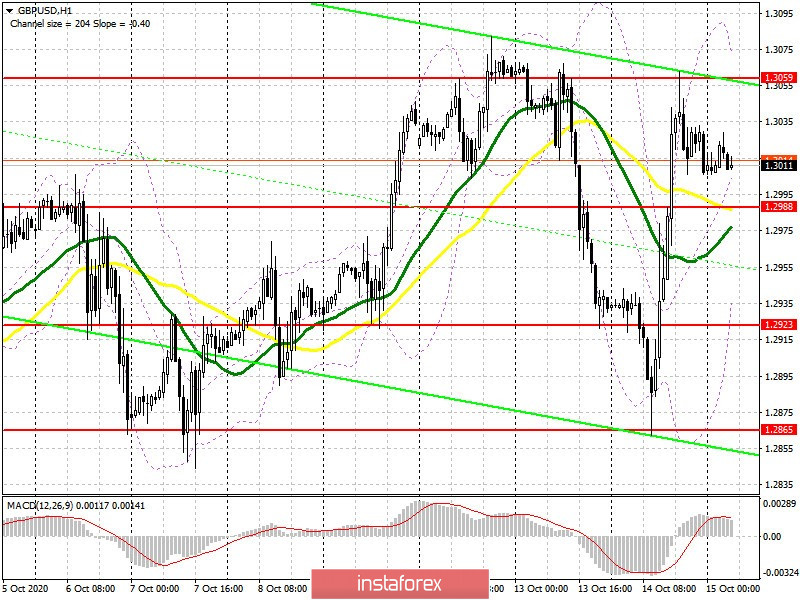
The technical picture has slightly changed at the moment. Buyers will focus on resistance at 1.3059 in the first half of the day, getting the pair to settle in this area will open the possibility for a new wave of growth for GBP/USD in the area of a high of 1.3154. Good news on Brexit will provide support to the pound, which will lead to a test of resistance at 1.3234, where I recommend taking profits. An equally important task is to protect support at 1.2988, just below which the moving averages pass. Forming a false breakout at this level will be a signal to open new long positions, counting on an upward trend. In case bulls are not active in this range, it is better not to rush to buy, but to wait for news on Brexit. In this case, the nearest major support levels will be seen in the area of 1.2923 and 1.2865, from where you can consider buy positions for a rebound upon reaching it, counting on a correction of 20-30 points within the day.
The Commitment of Traders (COT) report for October 6 showed a minimal increase in short non-commercial positions from 51,961 to 51,996. Long non-commercial positions slightly rose from 39,216 to 40,698. As a result, non-commercial net position remained negative and reached -11,298 against -12,745, which indicates that sellers of the pound retain control and also shows their slight advantage in the current situation. The higher the pair grows, the more attractive it is to sell.
To open short positions on GBP/USD, you need:
Sellers need to defend resistance at 1.3059, but a lot will depend on news on the trade deal and on the decisions taken at the Eurogroup meeting. Forming a false breakout at 1.3059 generates a signal to sell the pound, but bad news on Brexit is necessary to exert pressure on the pair. After consolidating below support at 1.2988, we can finally expect the pair to fall and return to the 1.2923 area. I recommend taking profit in the 1.2865 area, since large buyers are most likely present in that area. In the absence of activity in the resistance area of 1.3059, it is best to postpone short positions until the resistance at 1.3154 has been tested, and you can also sell immediately on a rebound from the high of 1.3234. At least you can expect the bull market to stop at these levels.

Indicator signals:
Moving averages
Trading is carried out above 30 and 50 moving averages, which indicates another attempt by the bulls to take control of the market.
Note: The period and prices of moving averages are considered by the author on the H1 hourly chart and differs from the general definition of classic daily moving averages on the D1 daily chart.
Bollinger Bands
A breakout of the upper border of the indicator around 1.3059 will lead to a large wave of growth in the pound. A breakout of the lower border of the indicator in the 1.2965 area will increase the pressure on the pair.
Description of indicators
- Moving average (moving average, determines the current trend by smoothing out volatility and noise). Period 50. It is marked in yellow on the chart.
- Moving average (moving average, determines the current trend by smoothing out volatility and noise). Period 30. It is marked in green on the chart.
- MACD indicator (Moving Average Convergence/Divergence — convergence/divergence of moving averages) Quick EMA period 12. Slow EMA period to 26. SMA period 9
- Bollinger Bands (Bollinger Bands). Period 20
- Non-commercial speculative traders, such as individual traders, hedge funds, and large institutions that use the futures market for speculative purposes and meet certain requirements.
- Long non-commercial positions represent the total long open position of non-commercial traders.
- Short non-commercial positions represent the total short open position of non-commercial traders.
- Total non-commercial net position is the difference between short and long positions of non-commercial traders.
 English
 Русский
 Bahasa Indonesia
 Bahasa Malay
 ไทย
ไทย Español
 Deutsch
 Български
 Français
 Tiếng Việt
 中文
中文 বাংলা
বাংলা हिन्दी
 Čeština
 Українська
 Română

