To open long positions on GBP/USD, you need to:
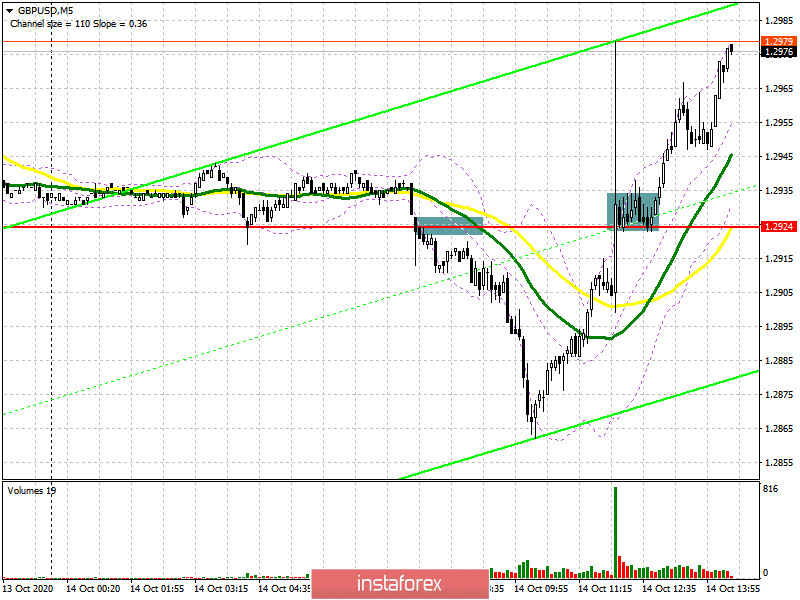
In my morning forecast, I recommended selling the British pound after breaking the level of 1.2924, which happened. Let's look at the 5-minute chart and try to figure out what happened. A break of 1.2924 further along the trend at the beginning of the European session led to a fairly large movement of the pound down, which amounted to more than 60 points. However, there were rumors on the market that the EU and the UK are very close on the issues of a trade agreement, which led to a sharp increase of GBP/USD up to the level of 1.2924. Fixing above this range led to the formation of a good entry point into purchases, which is now continuing to be implemented.

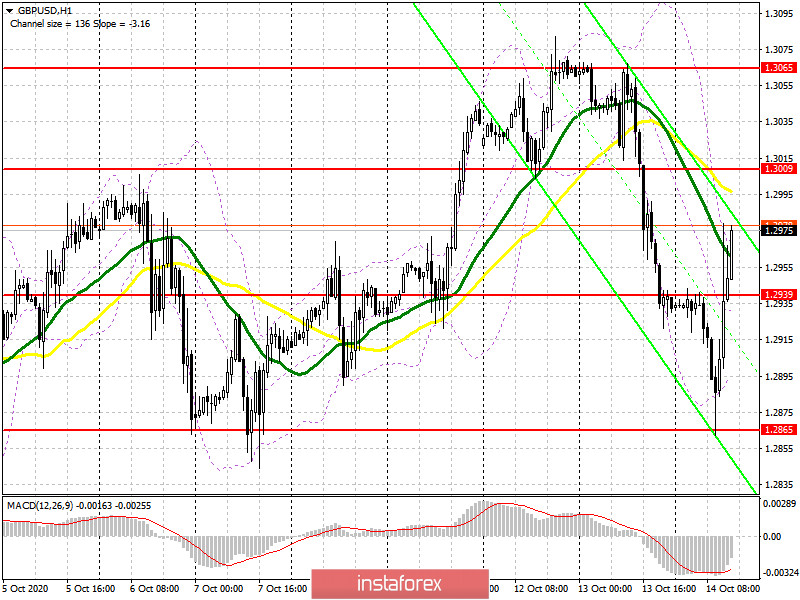
The levels have changed. The nearest target of the bulls is the resistance of 1.3009. However, in the event of a breakout and consolidation at this level, you can continue to buy the pound in the expectation of updating the weekly highs of 1.3065-70, where I recommend fixing the profits. If the rumors remain rumors, and the parties make statements that a consensus could not be found again, do not be surprised by a major drop in the pound. In this scenario, you can only open long positions after forming a false breakout at 1.2939. I recommend buying GBP/USD immediately for a rebound only from the minimum of 1.2865, where the first market reversal took place today. If you re-test this level, you can also expect a bounce up by 20-30 points.
To open short positions on GBP/USD, you need:
Sellers did everything that was required of them, however, the market did not find a continuation against the background of regular rumors. Now we need official information. Short positions can only be opened after a false breakout is formed in the resistance area of 1.3009, which will lead to a downward correction of GBP/USD to the support area of 1.2939. In the case of negative news on the trade agreement, you can expect a larger decline in GBP/USD to the area of the minimum 1.2865, where I recommend fixing the profits. If the demand for the pound continues in the second half of the day above the level of 1.3009, it is better not to rush with sales, but wait for the update of the maximum of 1.3065, from where you can open short positions immediately for a rebound in the expectation of correction of 30-40 points within the day.

Let me remind you that in the COT reports (Commitment of Traders) for October 6, there was a minimal increase in short non-commercial positions from the level of 51,961 to the level of 51,996. Long non-profit positions slightly increased from the level of 39,216 to the level of 40,698. As a result, the non-commercial net position remained negative and amounted to -11,298, against -12,745, which indicates that sellers of the British pound remain in control and have a minimal advantage in the current situation. The higher the pair grows, the more attractive it will become for sale.
Signals of indicators:
Moving averages
Trading has already returned to the 30 and 50 daily averages, which indicates a possible capitulation of the pound sellers in the near future.
Note: The period and prices of moving averages are considered by the author on the hourly chart H1 and differ from the general definition of classic daily moving averages on the daily chart D1.
Bollinger Bands
If the pair declines, the lower border of the indicator around 1.2885 will provide support.
Description of indicators
- Moving average (moving average determines the current trend by smoothing out volatility and noise). Period 50. The graph is marked in yellow.
- Moving average (moving average determines the current trend by smoothing out volatility and noise). Period 30. The graph is marked in green.
- MACD indicator (Moving Average Convergence / Divergence - moving average convergence / divergence) Fast EMA period 12. Slow EMA period 26. SMA period 9
- Bollinger Bands (Bollinger Bands). Period 20
- Non-profit speculative traders, such as individual traders, hedge funds, and large institutions that use the futures market for speculative purposes and meet certain requirements.
- Long non-commercial positions represent the total long open position of non-commercial traders.
- Short non-commercial positions represent the total short open position of non-commercial traders.
- Total non-commercial net position is the difference between the short and long positions of non-commercial traders.
 English
 Русский
 Bahasa Indonesia
 Bahasa Malay
 ไทย
ไทย Español
 Deutsch
 Български
 Français
 Tiếng Việt
 中文
中文 বাংলা
বাংলা हिन्दी
 Čeština
 Українська
 Română

