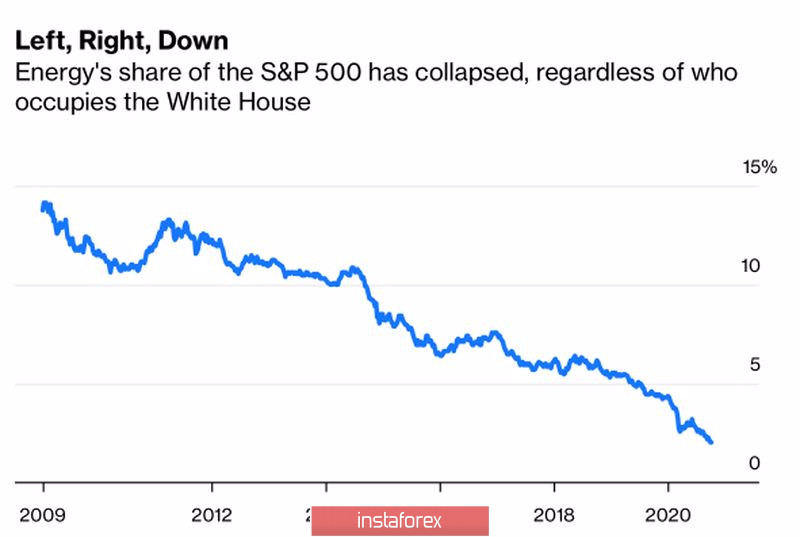
A pandemic can have about the same consequences for the oil market as a meteorite falling to Earth for dinosaurs. The price of $100 per barrel is not worth dreaming about, because the gradual replacement of black gold with alternative energy sources can gradually lead to its death. The processes have accelerated due to COVID-19 and increased demand for shares of "green" companies whose activities are aimed at improving the climate. Their share in the S&P 500 structure is rising, while the share of oil corporations, on the contrary, is falling. Under Barack Obama, it was about 15%, while at the beginning of the presidency of Donald Trump, it dropped to 5-7%, and in the run-up to the elections on November 3, it fell to 2%.
Dynamics of the share of oil companies in the structure of the S&P 500:

The victory of Joe Biden may completely ruin the industry because of the Democrat's intentions to switch to alternative energy sources. It is possible that he will return to the nuclear agreement with Iran, which will increase the export of black gold from the US by 500,000 b/d by the third quarter of 2021. However, by that time, the growth of global demand and the weakening of the US dollar can compensate for this negative.
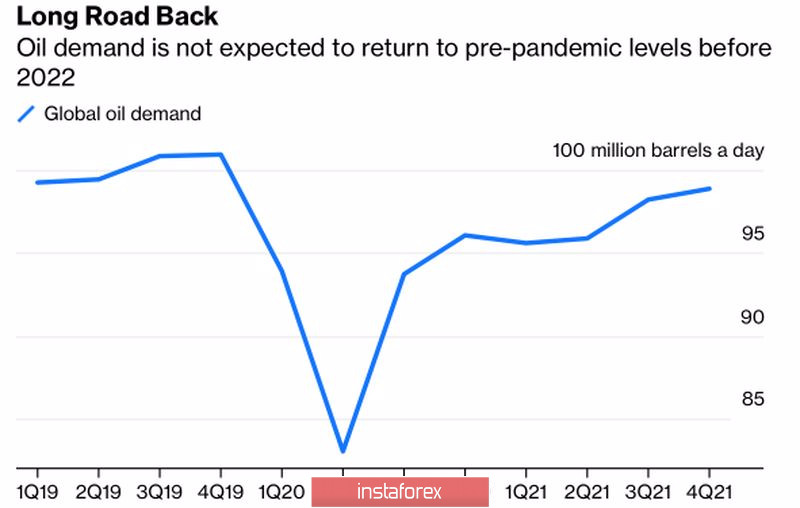
According to the IEA forecasts, in 2020 and 2021, oil demand will be 8.4 million b/d and 2.1 million b/d less than in 2019. At best, the indicator will return to its pre-crisis levels in 2023. And then with the massive use of vaccines and the associated return of the global economy to the trend. Otherwise, there will be a delayed recovery – demand will be able to rise to the levels of 2019 only in 2025. Such dynamics of the indicator makes the next couple of years an unpleasant time for all black gold producers.
Dynamics of global demand:

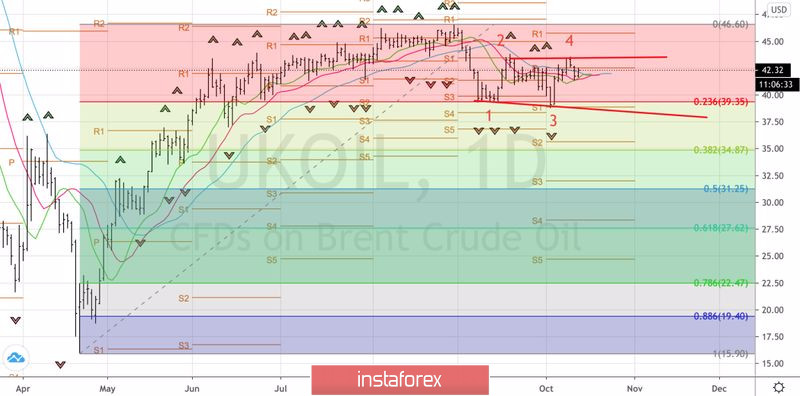
Thus, long-term prospects of Brent and WTI look bearish due to a large-scale transition to alternative energy sources, medium-term prospects, on the other hand, seems bullish due to recovery in global demand, and depressed supply. In the short-term, the North Sea variety has found a refuge in consolidation in the range of $39 - $43.5 per barrel. And there are reasonable explanations for this.
Factors such as the resumption of work after strikes in Norway, the restoration of Libyan mining and black gold production on the Gulf Coast, and the consideration of repeated restrictions due to COVID-19 in Britain, Italy, and the Czech Republic are offset by rising Chinese demand. In September, China's oil imports increased by 5.5% compared to August and by 17.5% compared to the same period last year. The indicator rose to 11.8 million b/d, which is one of the bright spots in the black gold market that leaves much to be desired.
Technically, a very interesting picture has developed on the daily Brent chart. A break in the resistance at $43.5 per barrel may lead to the recovery of the upward trend, but if the bulls fail to keep quotes above this level, the risks of forming a "Widening wedge" pattern will increase with the threat of oil falling to $39 per barrel or lower. Based on the closing price of the breakout bar at $43.5, we will build a trading strategy: buy above and sell below this level.
Brent daily chart:

 English
 Русский
 Bahasa Indonesia
 Bahasa Malay
 ไทย
ไทย Español
 Deutsch
 Български
 Français
 Tiếng Việt
 中文
中文 বাংলা
বাংলা हिन्दी
 Čeština
 Українська
 Română

