GBP/USD
Analysis:
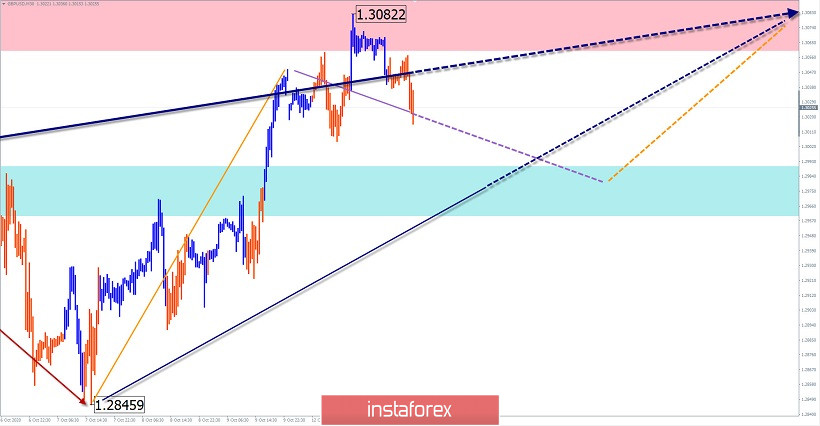
A new long-term trend has been forming on the chart of the major British currency since March. The first 2 parts (A-B) are formed in the wave structure. For the past month, a reversal pattern has been formed before the start of a new ascending section. The price reached the intermediate resistance zone.
Forecast:
In the upcoming trading sessions, a downward pullback, a reversal, and a second attempt at price growth are expected. If the upper limit of the nearest resistance is broken, the daily price range will expand to the next zone.
Potential reversal zones
Resistance:
- 1.3170/1.3200
- 1.3060/1.3090
Support:
- 1.2990/1.2960
Recommendations:
Today in the first half of the day, there will be conditions for short-term sales of the pound with a reduced lot. It is safer to stay out of the pair's market for the duration of the pullback and look for signals to enter long positions at its end.

USD/CHF
Analysis:
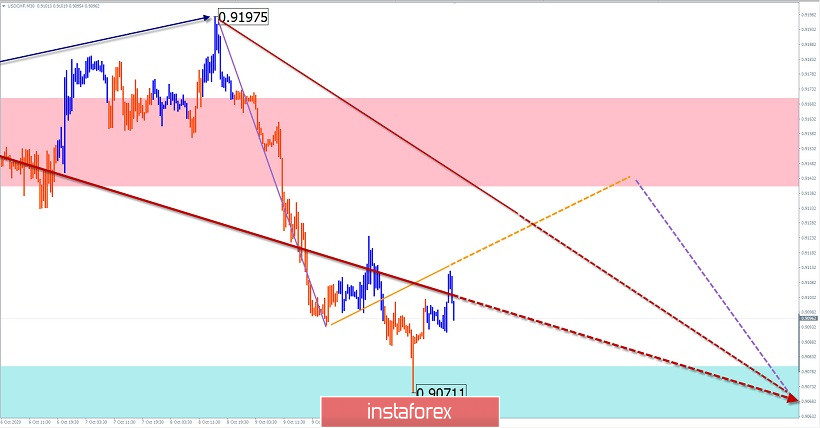
The Swiss Franc chart is dominated by a downward trend. Its last unfinished section started on September 25. By the current day, there is a need for an interim rollback. The pair's price has reached the upper limit of the intermediate support zone.
Forecast:
Today, we expect a general flat mood of the pair's movement. In the next session, price growth is likely in the resistance area. By the end of the day, you should expect a reversal and a repeated decline in the support area.
Potential reversal zones
Resistance:
- 0.9140/0.9170
Support:
- 0.9080/0.9050
Recommendations:
Trading on the pair's market today is only possible within the intra-session style with a reduced lot. Sales of the tool are safer.

Explanation: In the simplified wave analysis (UVA), waves consist of 3 parts (A-B-C). The last incomplete wave is analyzed. The solid background of the arrows shows the formed structure, and the dotted background shows the expected movements.
Note: The wave algorithm does not take into account the duration of the instrument's movements in time!
 English
 Русский
 Bahasa Indonesia
 Bahasa Malay
 ไทย
ไทย Español
 Deutsch
 Български
 Français
 Tiếng Việt
 中文
中文 বাংলা
বাংলা हिन्दी
 Čeština
 Українська
 Română

