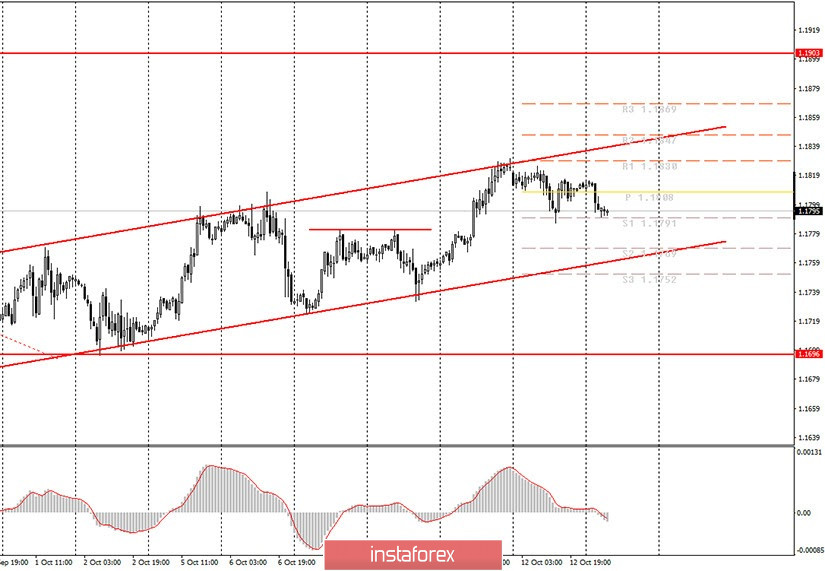
Hourly chart of the EUR/USD pair

The EUR/USD pair began a new round of corrective movement last Monday night, as we expected in yesterday's evening article. Thus, at the moment we conclude that the correction continues, and the price may fall to the lower line of the ascending channel. Take note that the price has reached the support level of 1.1791, the level from which it rebounded yesterday. Thus, it is quite possible that the correction will be completed in the near future. The MACD indicator has discharged to the zero level, as we wanted, so now we can look for new entry points to the market and wait for buy signals. In general, the trend for the euro/dollar pair remains moderately upward. Not too large a channel slope and frequent corrections indicate that buyers are not rushing to the market at breakneck speed. However, the sellers' positions are even weaker.
The fundamental background for the EUR/USD pair, in principle, remains the same, as can be seen from the nature of the pair's movement, which does not change. To date, we will only receive minor reports from the European Union today, which are unlikely to pique the interest of traders. You can pay attention to these reports, but you should not wait for the market reaction to them. First of all, we are talking about inflation in Germany, which, like in the entire European Union, is already in deflation (negative inflation = falling prices instead of rising). According to experts' forecasts, deflation in Germany will remain so until the end of September. However, as we mentioned in yesterday's article, you should not attach too much importance to this factor. The euro has significantly grown in the past six months, which also affects inflation due to import-export operations. The same goes for US inflation, which is scheduled to be published this afternoon. In annual terms, this figure may be +1.4%. Inflation excluding food and energy products (more precise inflation) may be +1.7% y/y. However, the same thing - due to the strong decline in the dollar in recent months, this value can be misleading. In general, we believe that there will be no reaction today even to such important indicators as inflation. The whole world continues to recover from the coronavirus crisis, and is also preparing for its second wave. Therefore, almost all macroeconomic indicators, except for the most important ones, such as GDP, remain a formality at this time. Political and epidemiological factors remain in the first place in terms of importance.
Possible scenarios for October 13:
1) Buy positions on the EUR/USD pair remain relevant at the moment due to the fact that the price continues to move inside the ascending channel. The downward correction may end near the support level of 1.1791. If the price overcomes this level before the MACD indicator turns up, forming a new buy signal, then the correction will continue to the lower border of the rising channel. When forming a buy signal, the targets will be the resistance levels 1.1830 and 1.1847.
2) Sell positions are currently not relevant. Traders could have earned several tens of points on a signal of a price rebound from the upper channel line, but we do not recommend opening new short positions at this time. To do this, you need to wait until the current upward trend has been cancelled, that is, for the price to settle below the upward channel.
On the chart:
Support and Resistance Levels are the Levels that serve as targets when buying or selling the pair. You can place Take Profit near these levels.
Red lines are the channels or trend lines that display the current trend and show in which direction it is better to trade now.
Up/down arrows show where you should sell or buy after reaching or breaking through particular levels.
The MACD indicator (14,22,3) consists of a histogram and a signal line. When they cross, this is a signal to enter the market. It is recommended to use this indicator in combination with trend lines (channels and trend lines).
Important announcements and economic reports that you can always find in the news calendar can seriously influence the trajectory of a currency pair. Therefore, at the time of their release, we recommended trading as carefully as possible or exit the market in order to avoid a sharp price reversal.
Beginners on Forex should remember that not every single trade has to be profitable. The development of a clear strategy and money management are the key to success in trading over a long period of time.
 English
 Русский
 Bahasa Indonesia
 Bahasa Malay
 ไทย
ไทย Español
 Deutsch
 Български
 Français
 Tiếng Việt
 中文
中文 বাংলা
বাংলা हिन्दी
 Čeština
 Українська
 Română

