Last week, the Japanese yen was the only one of all major currencies that declined against the US dollar. In my personal opinion, this is mostly due to technical factors, which will be the main focus of this article.
Weekly

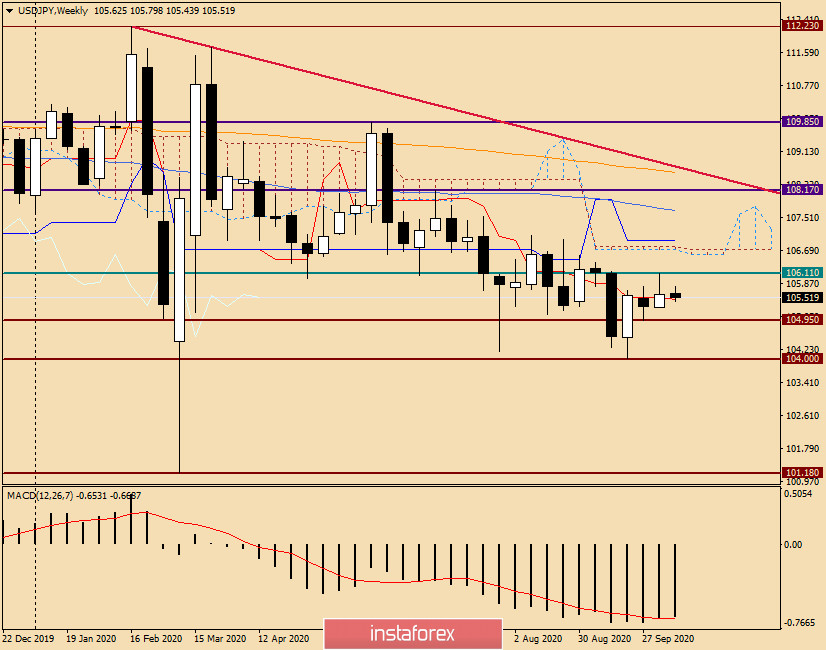
Although the USD/JPY currency pair showed growth at the auction on October 5-9, it is not possible to call it confident and stable due to the presence of a long upper shadow, which is larger than the size of the bullish body of the last candle. Usually, such candles indicate significant difficulties regarding further growth and signal a reversal of the exchange rate. However, reversals are different. This can be a reversal to continue the main dynamics, as well as a reversal to correct the rate or change the trend. In this case, I'm more inclined to the first option, and here's why. The pair did not show a confident overcoming of the red Tenkan line of the Ichimoku indicator. At the closing price, the last week ended above Tenkan. However, the proximity to this line, the inability to pass the strong price zone of 106.00-106.20, as well as the already mentioned long upper shadow of the previous candle is more bearish. Confirmation of this conclusion will be a true breakdown of the iconic psychological level of 105.00 and the closing of trading at 104.95, where the minimum values of the week before last were recorded. If the USD/JPY bears manage to solve this problem, their next target will be another serious level of 104.00, where there is strong support. I believe that the designated tasks for players to lower the exchange rate are quite up to the task, but much will depend on market sentiment, and first of all in relation to the US currency.
In my opinion, the bulls have more complex tasks for this instrument. Even passing up the strong price resistance zone of 106.00-106.20 will not answer the bull market for the dollar/yen. The price zone of 106.70-107.00 will be the next serious test for bulls on this instrument. This is where both borders of the weekly Ichimoku cloud pass and the blue Kijun line is located. I would like to note that the achievement of these prices will be possible only if the last highs are reached at 106.11.
Daily

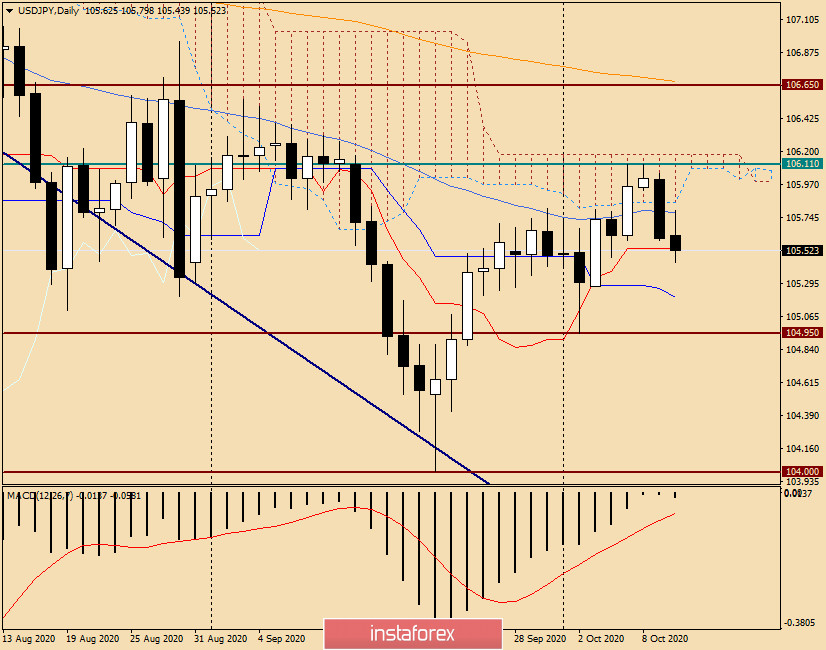
The daily USD/JPY chart shows a bearish picture. As you can see, the pair could not stay within the Ichimoku cloud, let alone exit it up. As a result of Friday's weakening of the US dollar across the entire spectrum of the currency market, the pair fell from the daily cloud and ended trading on October 9 with the formation of an impressive bearish candle. At the same time, the quote broke through the 50 simple moving average, and if the downward scenario continues, it will test the Tenkan and Kijun lines, which are located at 105.53 and 105.25, respectively. By the way, near these prices, support is not excluded, which may provoke an upward rebound.
Taking into account the technical picture on the considered timeframes, the main trading recommendation is sales, which should be considered after corrective pullbacks to a strong technical zone of 105.75-106.00. If bearish candlestick analysis patterns appear in the designated area on the daily, four-hour, and/or hourly timeframes, this will be a signal to open short positions on USD/JPY.
 English
 Русский
 Bahasa Indonesia
 Bahasa Malay
 ไทย
ไทย Español
 Deutsch
 Български
 Français
 Tiếng Việt
 中文
中文 বাংলা
বাংলা हिन्दी
 Čeština
 Українська
 Română

