Technical outlook:
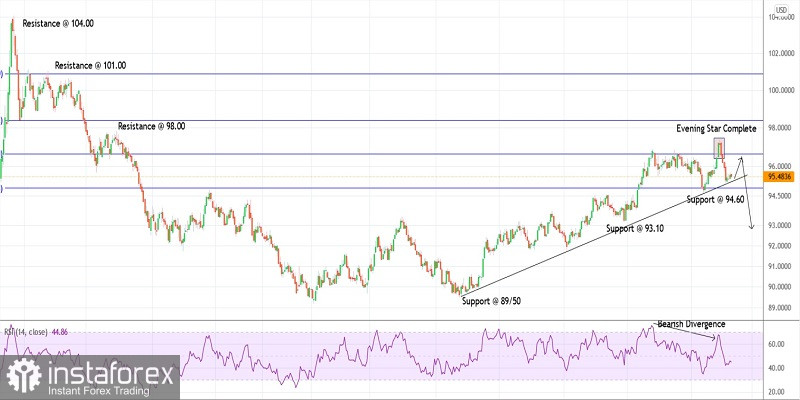
The US dollar index continues to drift sideways within a tight range between 95.50 and 95.00 over the last two trading sessions. Potential remains for yet another low toward 94.60 mark before producing its counter trend rally. The 94.60 mark is also initial support on the daily chart as labelled here and bears would confirm they are back in control.
The index seems to have already turned lower from 97.30-40 mark after producing a bearish Evening Star candlestick pattern. Also note that the above pattern was accompanied by a strong bearish divergence on the daily RSI as shown on the chart. The US dollar index has dropped almost 250 points since recent swing highs over the last week.
The trend might have turned lower since 97.30-40 is close to the Fibonacci 0.618 retracement of the primary drop between 104.00 and 89.20 levels as depicted on the chart. High probability remains for a bearish swing to terminate below 89.20 in the next several weeks. We are projecting short term price target below 93.10 level.
Trading plan:
Potential drop through 93.00 and lower against 98.00
Good luck!
 English
 Русский
 Bahasa Indonesia
 Bahasa Malay
 ไทย
ไทย Español
 Deutsch
 Български
 Français
 Tiếng Việt
 中文
中文 বাংলা
বাংলা हिन्दी
 Čeština
 Українська
 Română

