Before we proceed to the price charts of the GBP/USD currency pair, let's recall the main event of last week, which was undoubtedly the US labor market data for September. Let me remind you that the number of newly created jobs in the non-agricultural sectors of the American economy was below expectations of 850 thousand and amounted to 661 thousand. According to analysts at a major commercial bank, the world's leading economy has already managed to compensate for just over half of the jobs lost before the COVID-19 pandemic, and this can be considered a fairly good result. However, the subsequent recovery will be more painful and will take much longer. In addition, it is necessary to take into account that the coronavirus epidemic does not think to subside. Moreover, many virologists believe that the second wave of COVID-19 has already begun, which will peak in November and February. Given this probability, the timing of the final recovery of the world's leading economy is anyone's guess. One thing is clear: the recovery period will take an indefinite amount of time. In fact, this is what the head of the Federal Reserve System (FRS), Jerome Powell, said in his recent speeches.
If we turn to the British theme, then along with the coronavirus, market participants are concerned about the United Kingdom's trade deal with the European Union, which has less and less time to conclude. One of the most acute and unsolved problems is fishing, as well as the conditions of equal competition. The next meeting of the European Council will be held on October 15. However, there is a very small chance that there will be drastic changes in the Brexit process before then. Despite the fact that the UK promises to make every effort to conclude a trade agreement, so far all this remains only in words. However, as they say: "Hope dies last."
Weekly

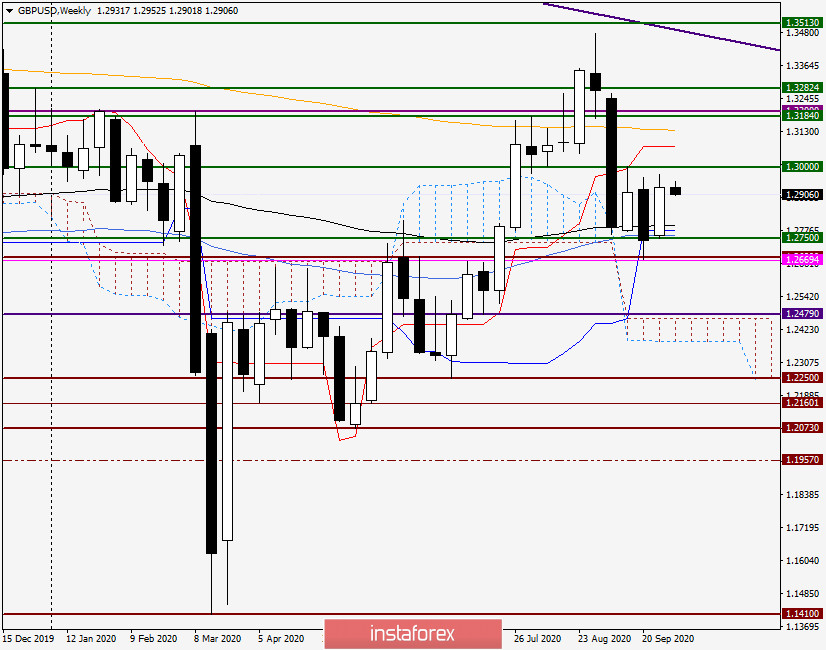
Despite mixed data on the US labor market, the continuing deterioration of the situation with the spread of the COVID-19 pandemic, and the introduction of restrictions in many countries, the US dollar failed to continue strengthening against the British pound at last week's trading. The GBP/USD currency pair managed to find support at the strong technical level of 1.2750, from which it began an active recovery. As a result, the last five-day trading closed at another rather significant level of 1.2930. Naturally, this is below the iconic psychological level of 1.3000, but above the strong technical zone of 1.2900-1.2920, which was repeatedly mentioned in previous articles on GBP/USD.
With a high degree of probability, we can assume that the pair's further decline was limited by the 89 exponential and 50 simple moving averages, as well as the Kijun line of the Ichimoku indicator, which is located under another significant mark of 1.2800. Now we will determine the further direction of the British currency in each of the parties. If the pound continues to strengthen, the next targets will be 1.2977, 1.3000, 1.3047, 1.3076, and possibly 1.3136. It is characteristic that the last two marks are the Tenkan line of the Ichimoku indicator and the 200 exponential moving average. At the same time, only a true breakdown of the orange 200 EMA (1.3136) will open the way to higher targets, which are located in the area of 1.3480-1.3513. Players on the downside need to rewrite the lows of the last two weeks 1.2750 and 1.2673 to resume the bearish scenario. In the event of a breakdown of the last mark, it is possible that the exchange rate will fall to the psychological level of 1.2500, where the further direction of this currency pair will be decided.
Daily

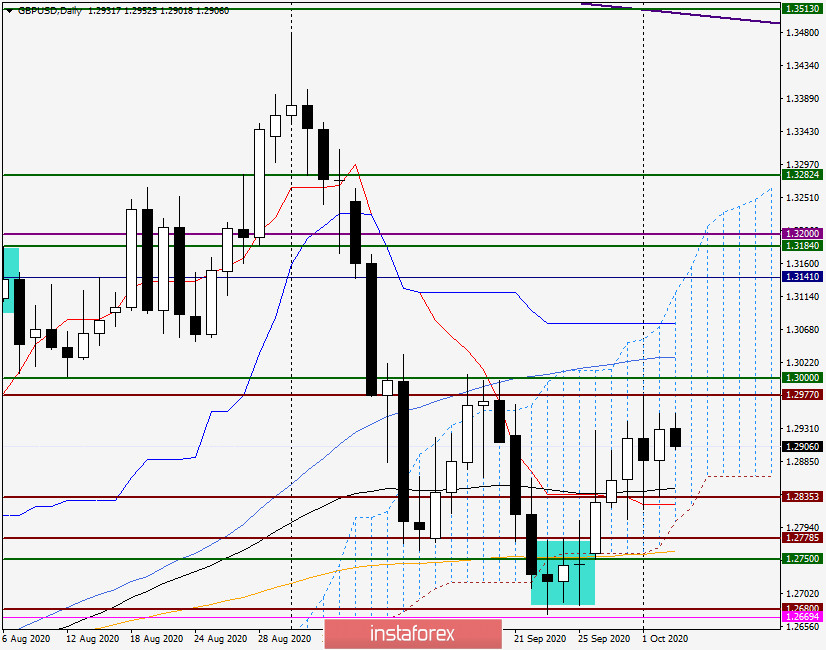
On the daily chart, the highlighted candles that were previously assumed to be reversal candles turned out to be just that. After that, the quote began to move in a northerly direction. On the last day of last week, the pound bears tried to resume pressure, however, it was limited by the 89 exponential (black), as well as the red Tenkan line.
Given that the pound/dollar pair is trading around the middle of the daily Ichimoku cloud, it is reasonable to assume that the further direction of the price will depend on which way the exit from the cloud takes place. Given that 50 MA and the Kijun line are located near the upper border of the cloud, and 200 EMA is located right at the lower border, it is quite difficult to exit the cloud and assumes a strong driver. Judging by the technical picture on the daily timeframe, the probability of price movement of GBP/USD and positioning in both directions remains. Purchases look good after falling to the price zone of 1.2885-1.2840, and sales after rising to the strong resistance zone of 1.2977-1.3000. At the same time, in both cases, before opening positions, I recommend enlisting the support of the corresponding candle signals that will appear on the four-hour and (or) hourly timeframes.
 English
 Русский
 Bahasa Indonesia
 Bahasa Malay
 ไทย
ไทย Español
 Deutsch
 Български
 Français
 Tiếng Việt
 中文
中文 বাংলা
বাংলা हिन्दी
 Čeština
 Українська
 Română

