Technical outlook:
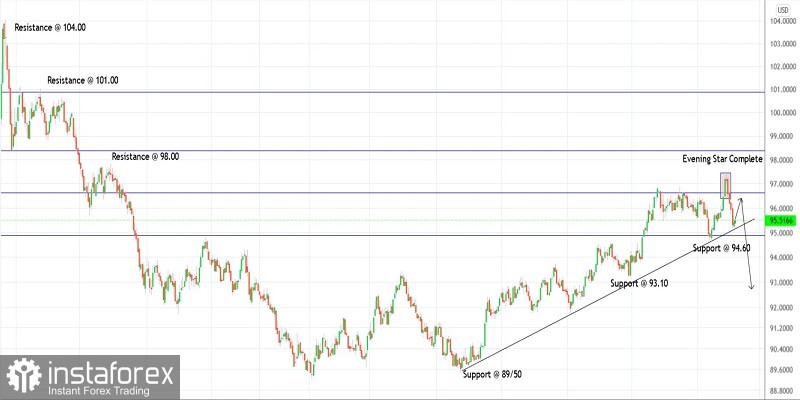
The US dollar index has dropped to fresh lows around 95.10 mark over the last week before finding some support. The index remained shy of breaking below 94.50-60 initial support and its trend line as marked on the daily chart here. Nevertheless, it could still produce a bearish move toward 93.00 and further in the coming days.
At the moment, the index is seen to be trading around 95.50 and might pullback up to 96.50 levels before resuming lower again. Bears might be inclined to be back in control and drag prices below 89.20 in the next several weeks. Only a consistent break above 97.40 will change the structure to bullish going forward.
The overall larger degree wave structure is also depicting a bearish outlook as the US dollar index had earlier dropped between 104.00 and 89.20 levels carving a meaningful downswing. The subsequent rally between 89.20 and 97.40 has been corrective and reached close to the Fibonacci 0.618 retracement of earlier drop. If the above holds well, potential remains for a drop below 89.20 to complete the structure.
Trading plan:
Potential drop to 91.50 against 98.00
Good luck!
 English
 Русский
 Bahasa Indonesia
 Bahasa Malay
 ไทย
ไทย Español
 Deutsch
 Български
 Français
 Tiếng Việt
 中文
中文 বাংলা
বাংলা हिन्दी
 Čeština
 Українська
 Română

