 English
  Русский
 Bahasa Indonesia
 Bahasa Malay
 ไทย
ไทย Español
 Deutsch
 Български
 Français
 Tiếng Việt
 中文
中文 বাংলা
বাংলা हिन्दी
 Čeština
 Українська
 Română

The pair tried to break through the resistance level 1.2940 (black thick line) on Friday. Today, the price may roll back down. According to the economic calendar, pound news is expected at 08:30 UTC, and dollar news is at 14:00 UTC.
Trend analysis (Fig. 1).
The market may move downward from the level of 1.2935 (closing of Friday's daily candlestick) with the target of 1.2863 - a 38.2% pullback level (red dotted line). Upon testing this level, the downward trend may continue with the next target of 1.2827 - a 50.0% pullback level (red dotted line).
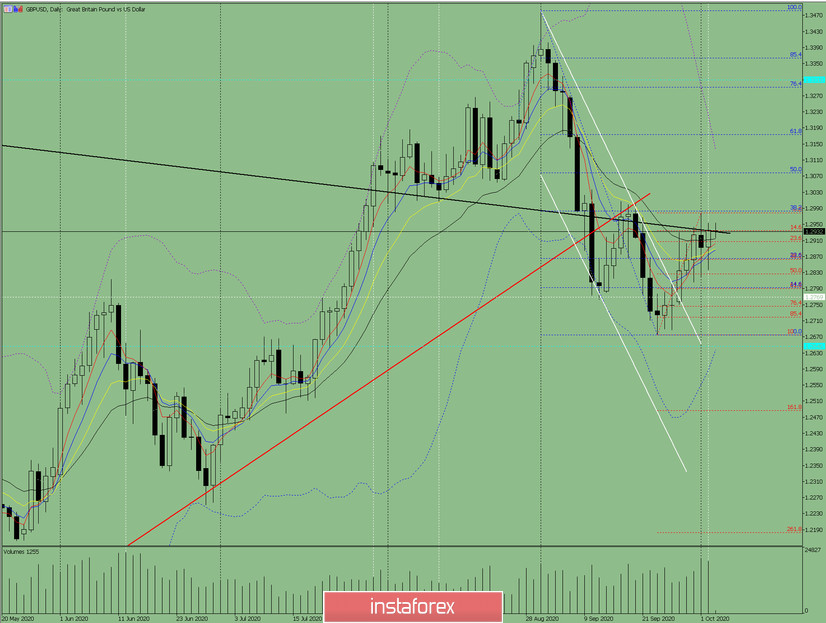
Figure: 1 (daily chart).
Complex analysis:
- Indicator analysis - down;
- Fibonacci levels - down;
- Volumes - down;
- Candlestick analysis - up;
- Trend analysis - down;
- Bollinger lines - up;
- Weekly chart - up.
General conclusion:
Today, the price may move down with the target at 1.2863 - a 38.2% pullback level (red dotted line). Upon testing this level, the downward trend may continue with the next target of 1.2827 - a 50.0% pullback level (red dashed line).
Another possible scenario: from the level of 1.2748, the price may move down with the target at 1.2863 - a 38.2% pullback level (red dotted line). From this level, the price may begin to move upward with the target at the resistance level 1.2932 (black bold line).