GBP/USD
Analysis:
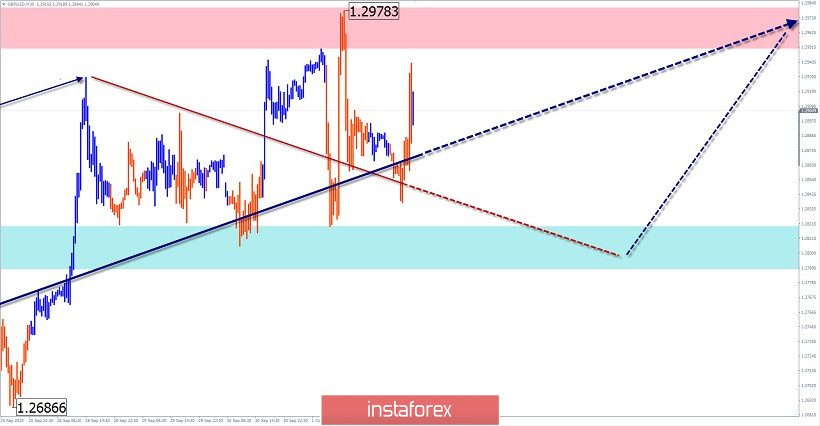
An upward wave has been forming on the chart of the British pound since March. Three weeks ago, the middle part of the wave structure (B) was completed. The rising wave that started later has a reversal potential. It is nearing the end of an interim correction.
Forecast:
Today, the price is expected to move in the corridor between the opposite zones. There may be pressure for support in the European session. You can expect a second ascent by the end of the day.
Potential reversal zones
Resistance:
- 1.2950/1.2980
Support:
- 1.2820/1.2790
Recommendations:
Today, the pound can be traded within trading sessions in the market. The boundaries of the probable move are marked by counter zones. Purchases of the tool remains a priority.

EUR/JPY
Analysis:
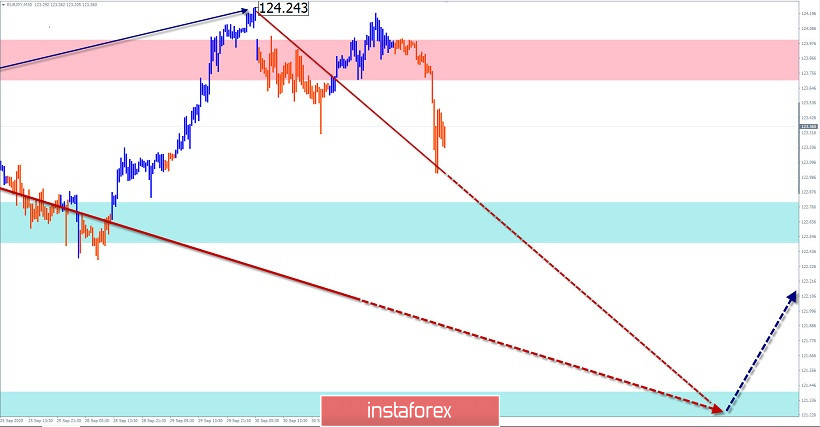
The pair's chart has been showing a steady downward trend over the past 2 years. Since June 5, at the end of the next correction, a reversal wave model is formed in the direction of the main trend. The structure of the wave shows a clear zigzag. In the last 2 weeks, an intermediate pullback is formed within the last part.
Forecast:
A mostly bearish movement vector is expected today. In the first half of the day, a short-term price rise in the area of the resistance zone is not excluded. If the nearest zone is breached, a decline to the next support is possible today.
Potential reversal zones
Resistance:
- 123.70/124.00
Support:
- 122.80/122.50
- 121.40/121.10
Recommendations:
There are no conditions for the pair's purchases today. At the end of counter-movements, we recommend selling the pair. It is safer to reduce the trading lot.

USD/CHF
Analysis:
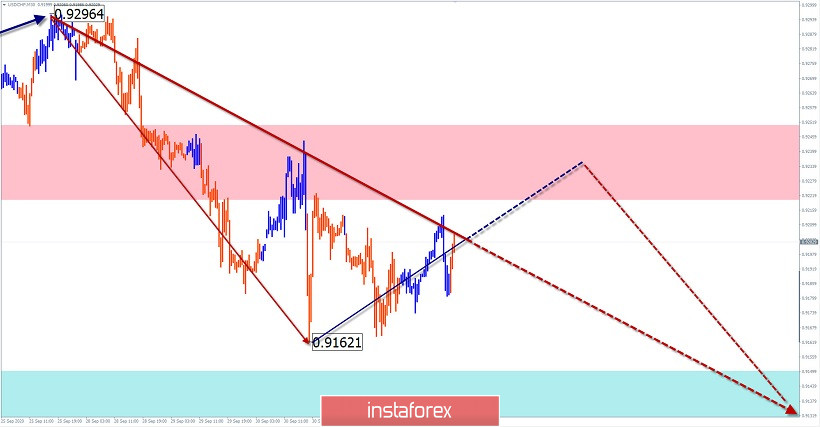
Since March this year, the Swiss franc chart has been dominated by a bearish trend. Over the past two months, the price has formed a sideways correction. This wave is nearing completion. Since September 25, a reversal pattern has been developing downwards, which may be the beginning of a new wave at the main exchange rate of the pair.
Forecast:
Today, it is expected to move in the price corridor between the nearest zones. In the first half of the day, price growth is likely. A reversal and decline to the support zone can be expected at the end of the day or the beginning of the next trading week.
Potential reversal zones
Resistance:
- 0.9220/0.9250
Support:
- 0.9150/0.9120
Recommendations:
Trading today is only possible within the intraday, with a reduced lot. You should be careful when purchasing. It is more preferable to sell the tool.

Explanation: In the simplified wave analysis (UVA), waves consist of 3 parts (A-B-C). The last incomplete wave is analyzed. The solid background of the arrows shows the formed structure, and the dotted one shows the expected movements.
Note: The wave algorithm does not take into account the duration of the instrument's movements in time!
 English
 Русский
 Bahasa Indonesia
 Bahasa Malay
 ไทย
ไทย Español
 Deutsch
 Български
 Français
 Tiếng Việt
 中文
中文 বাংলা
বাংলা हिन्दी
 Čeština
 Українська
 Română

