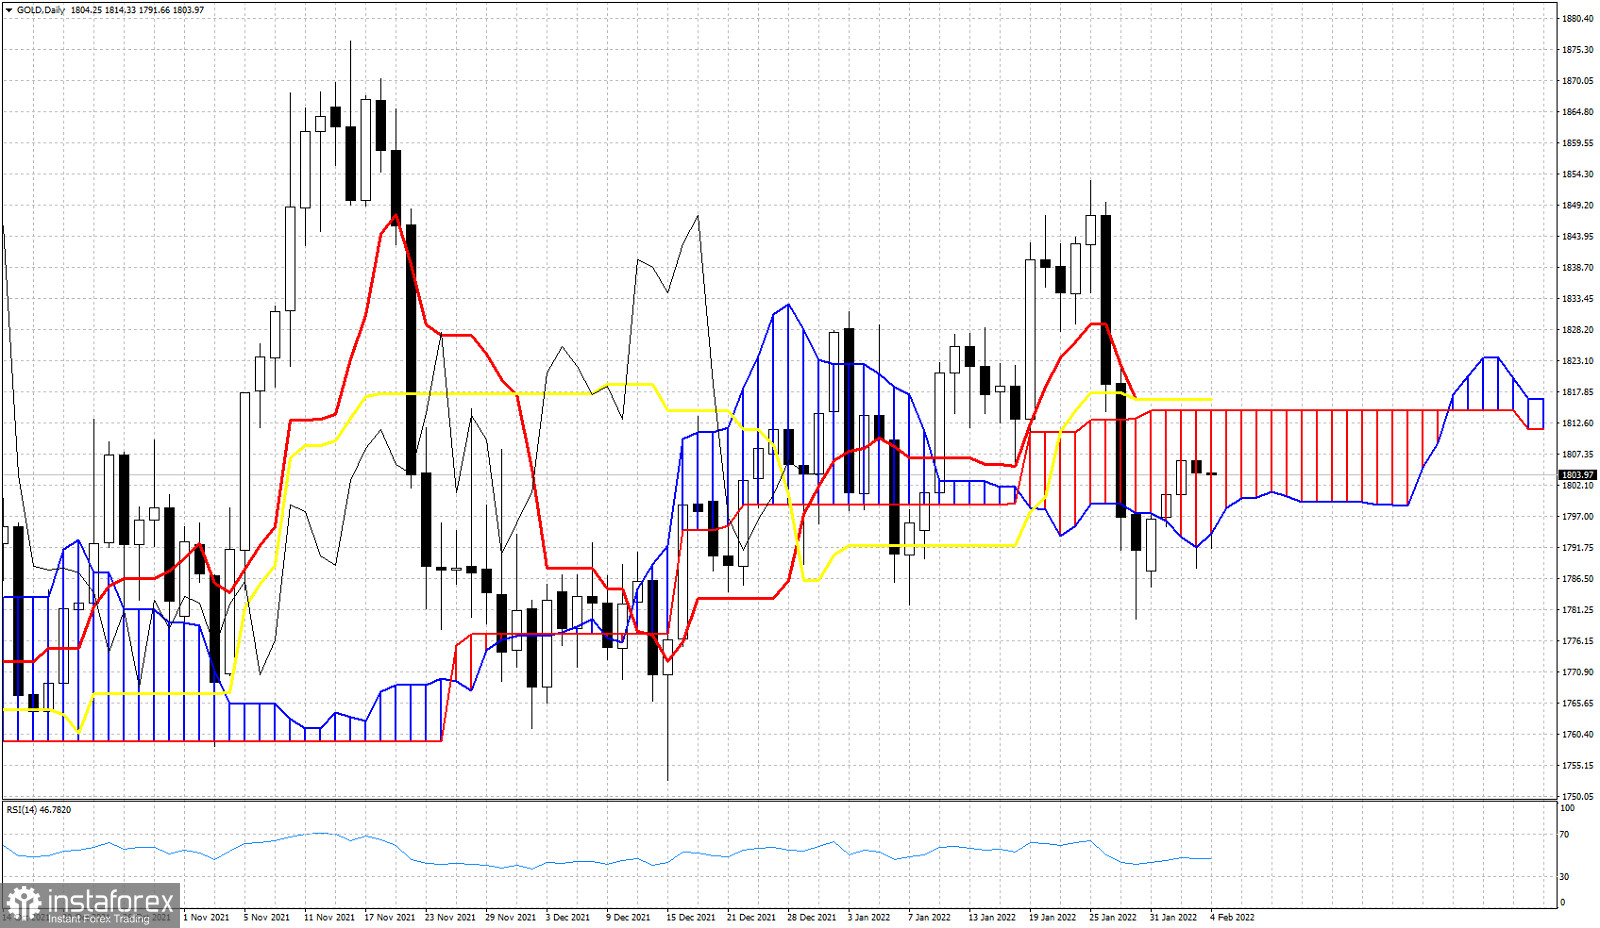
Gold price had increased volatility the last 24 hours as price fell as low as $1,788 yesterday, closed above $1,800 and today price fell again towards $1,790 while now it is trading at $1,805. Gold price is inside the Daily Kumo which means that trend is neutral. However the long lower tails in the last two candlesticks, show that price is supported.

Gold price has tested the lower cloud boundary twice and both times it was respected and bulls pushed price higher. Resistance at the upper cloud boundary is at $1,814 and this is the level bulls need to break in order to produce a new bullish signal. At $1,816 we currently find the tenkan-sen (red line indicator) and the Kijun-sen (yellow line indicator). This is also short-term resistance. Breaking above these two indicators will also be a bullish sign. Price remains supported and as long as we trade above yesterday's lows, bulls have the potential to push higher towards $1,825 or even $1,850-60.
*The market analysis posted here is meant to increase your awareness, but not to give instructions to make a trade

 English
 Русский
 Bahasa Indonesia
 Bahasa Malay
 ไทย
ไทย Español
 Deutsch
 Български
 Français
 Tiếng Việt
 中文
中文 বাংলা
বাংলা हिन्दी
 Čeština
 Українська
 Română

