Technical outlook:
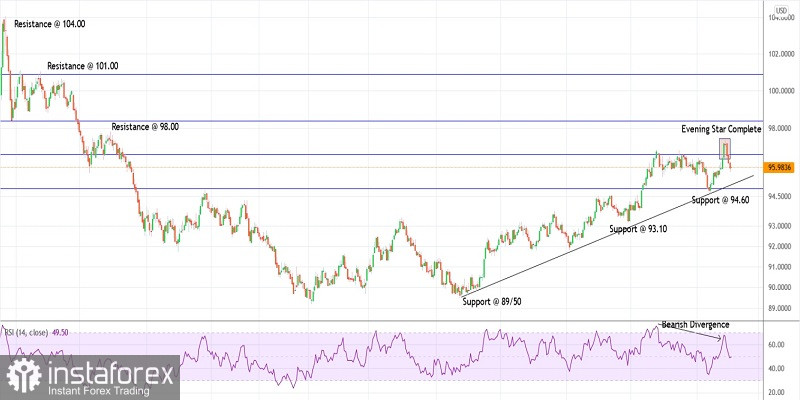
The US dollar index has dropped through 95.75 since hitting fresh swing highs around 97.37 last Friday. The index has dropped over 150 points in the last three trading sessions carving a black crow pattern on the daily chart. Ideally, prices would stay below the 97.30-40 mark to keep bears in control as they target below 94.50 in the near term.
The index had rallied through 97.30-40 zone over the last week but price action was accompanied by a strong bearish divergence on the daily chart as shown here. An evening star candlestick pattern was confirmed on Monday and prices continue to drag lower toward 94.50 initial support now. Also note that rising trend line support shall be broken below 94.50 mark.
Furthermore, the overall wave structure for US dollar index is also looking constructive for bears as they have carved a meaningful downswing between 104.00 and 89.20 levels earlier. The subsequent rally towards 97.30-40 looks corrective, which has managed to reach close to fibonacci 0.618 retracement of earlier drop. Potential remains for a print below 89.20 in the coming weeks.
Trading plan:
Potential drop below 94.50 against 98.00 near term
Good luck!
 English
 Русский
 Bahasa Indonesia
 Bahasa Malay
 ไทย
ไทย Español
 Deutsch
 Български
 Français
 Tiếng Việt
 中文
中文 বাংলা
বাংলা हिन्दी
 Čeština
 Українська
 Română

