Outlook on September 23:
Analytical overview of major pairs on the H1 scale:
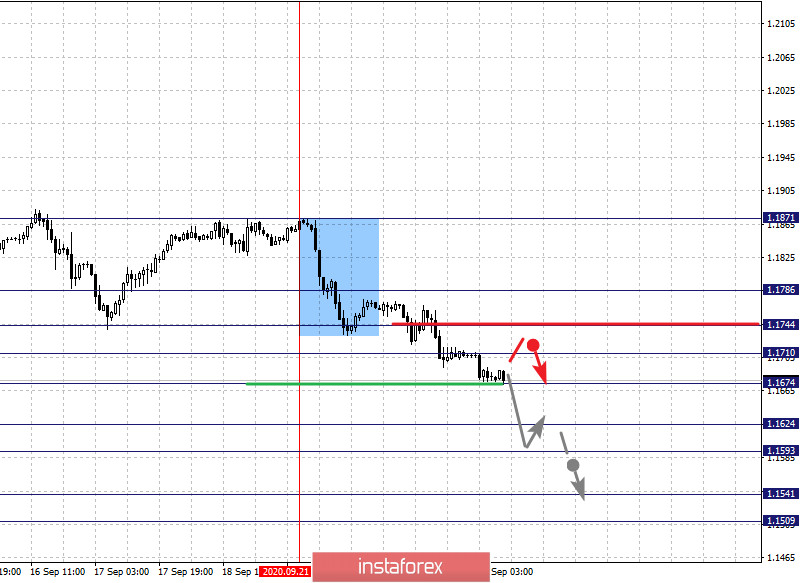
The key levels for the euro/dollar pair on the H1 chart are 1.1786, 1.1744, 1.1710, 1.1674, 1.1624, 1.1593, 1.1541 and 1.1509. We are following the descending structure from September 21 here. The decline is expected to continue after breaking through the level of 1.1674. In this case, the target is 1.1624. There is a short-term downward movement and consolidation in the range of 1.1624 - 1.1593. If the last value breaks down, it will lead to a sharp decline. The next goal will be the level of 1.1541. We consider the level of 1.1509 as a potential value for the bottom. Upon reaching which, we expect consolidation and upward pullback.
Now, a short-term upward movement is possible in the range of 1.1710 - 1.1744 and breaking through the last value will lead to a deep correction. The target is 1.1786, which is the key support for the downward structure.
The main trend is the descending structure from September 21
Trading recommendations:
Buy: 1.1710 Take profit: 1.1742
Buy: 1.1745 Take profit: 1.1786
Sell: 1.1672 Take profit: 1.1625
Sell: 1.1623 Take profit: 1.1594
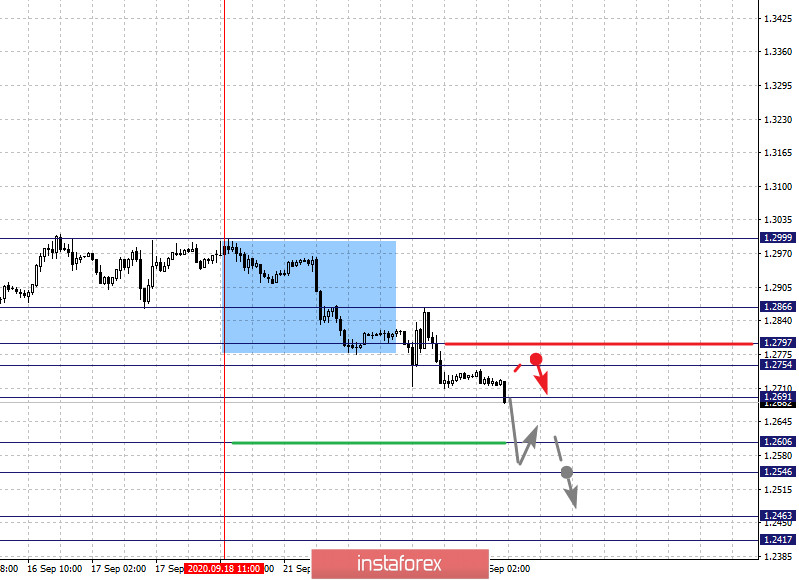
The key levels for the pound/dollar pair are 1.2866, 1.2797, 1.2754, 1.2691, 1.2606, 1.2546, 1.2463 and 1.2417. Here, we are following the development of the descending structure from September 18. Moreover, the downward movement is expected to continue after breaking through the level of 1.2690. In this case, the target is 1.2606. On the other hand, there is a short-term downward movement, as well as consolidation in the range of 1.2606 - 1.2546. If the last value breaks down, it will lead to a strong decline. Our next target will be 1.2463. For the potential value for the bottom, we have the level of 1.2417. Upon reaching which, we expect consolidation and upward pullback.
A short-term upward movement is expected in the range of 1.2754 - 1.2797. If the last value breaks down, it will lead to a deep correction. The next target is 1.2866, which is the key support for the downward structure.
The main trend is the descending structure from September 18
Trading recommendations:
Buy: 1.2754 Take profit: 1.2796
Buy: 1.2798 Take profit: 1.2866
Sell: 1.2689 Take profit: 1.2607
Sell: 1.2605 Take profit: 1.2547
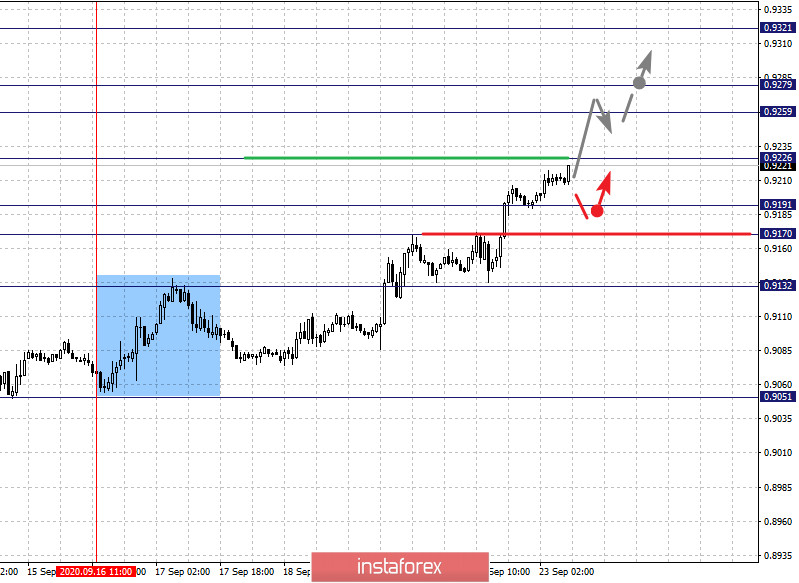
The key levels for the dollar/franc pair are 0.9321, 0.9279, 0.9259, 0.9226, 0.9191, 0.9170 and 0.9132. We are following the upward structure from September 16 here. The growth of the pair is expected to continue after the breakdown of 0.9226. In this case, the target is 0.9259. There is a short-term upward movement, as well as consolidation in the range of 0.9259 - 0.9279. We consider the level of 0.9321 as a potential value for the top; upon reaching this level, we expect a downward pullback.
A short-term downward movement is possible in the range of 0.9191 - 0.9170, and the breakdown of the last value will lead to a deep correction. The target is 0.9132, which is the key support for the top.
The main trend is the upward cycle of September 16
Trading recommendations:
Buy : 0.9226 Take profit: 0.9259
Buy : 0.9280 Take profit: 0.9320
Sell: 0.9190 Take profit: 0.9170
Sell: 0.9188 Take profit: 0.9134
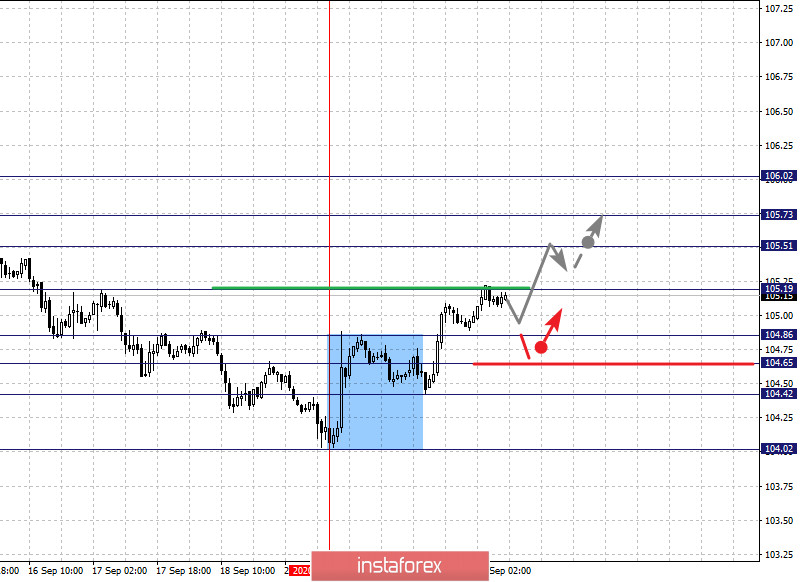
The key levels for the dollar/yen are 106.02, 105.73, 105.51, 105.19, 105.19, 104.86, 104.65 and 104.42. We are following the development of the downward pattern from September 21. Now, the upward movement is expected to continue after breaking through the level of 105.20. In this case, the target is 105.51. Meanwhile, there is a short-term upward movement and consolidation in the range of 105.51 - 105.73. We consider the level of 106.02 as a potential value for the top. Upon reaching which, we expect a downward pullback.
A short-term downward movement is expected in the range of 104.86 - 104.65. If the last value breaks down, it will lead to a deep correction. The target is 104.42, which is the key support for the upward structure.
The main trend is the upward structure from September 21
Trading recommendations:
Buy: 105.20 Take profit: 105.50
Buy : 105.52 Take profit: 105.71
Sell: 104.86 Take profit: 104.67
Sell: 104.63 Take profit: 104.43
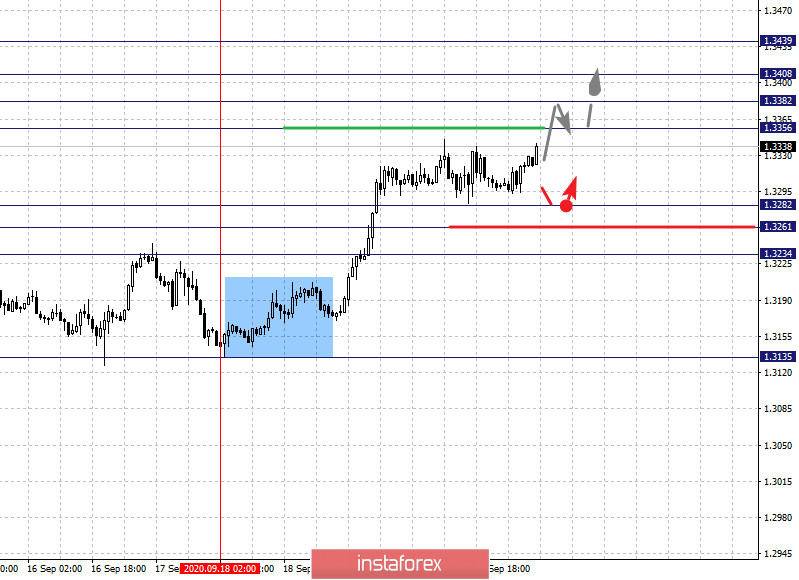
The key levels for the USD/CAD pair are 1.3439, 1.3408, 1.3382, 1.3356, 1.3282, 1.3261 and 1.3234. Here, the local upward structure from September 18th is being followed. The upward movement is expected to continue after the breakdown of 1.3356 (level 1.3282 is the key support). In this case, the target is 1.3382 and its breakdown will allow us to rely on movement to the level of 1.3408. There is consolidation near this value and hence a reversal into correction is very likely. We consider the level of 1.3439 as a potential value for the top. Upon reaching which, we expect a downward pullback.
A short-term downward movement is possible in the range 1.3282 - 1.3261. If the last value breaks down, it will lead to a deep correction. The next target is 1.3234, which is the key support for the main trend.
The main trend is the local upward structure of September 18
Trading recommendations:
Buy: 1.3357 Take profit: 1.3380
Buy : 1.3383 Take profit: 1.3408
Sell: 1.3282 Take profit: 1.3262
Sell: 1.3259 Take profit: 1.3234
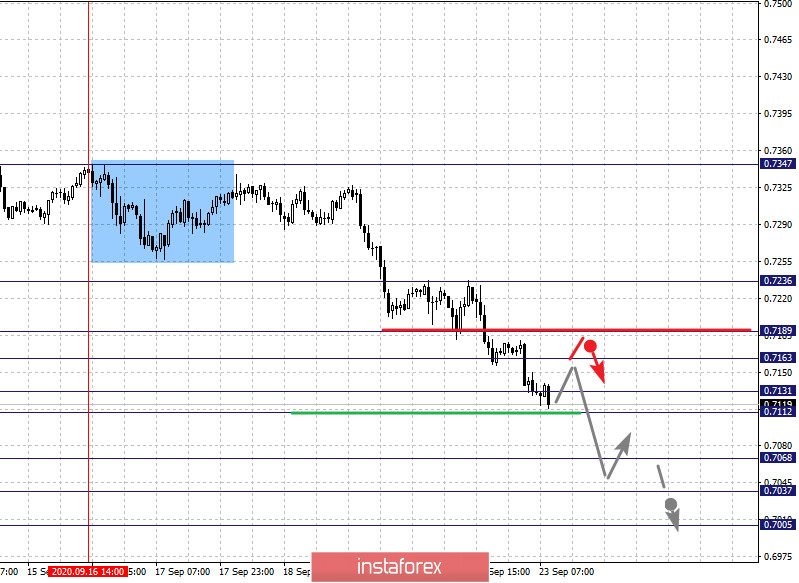
The key levels for the AUD/USD pair are 0.7236, 0.7189, 0.7163, 0.7131, 0.7112, 0.7068, 0.7037 and 0.7005. We are following the development of the downward trend cycle from September 16. The decline is expected to continue after the price passes the noise range 0.7131 - 0.7112. In this case, the target is 0.7068. There is a short-term downward movement and consolidation in the range of 0.7068 - 0.7037. For the potential value for the bottom, we have the level of 0.7005. Upon reaching which, we expect an upward pullback.
A short-term upward movement is possible in the range of 0.7163 - 0.7189. If the last value breaks down, it will lead to a deep correction. Here, the target is 0.7236.
The main trend is the downward cycle from September 16
Trading recommendations:
Buy: 0.7163 Take profit: 0.7189
Buy: 0.7191 Take profit: 0.7236
Sell : 0.7111 Take profit : 0.7070
Sell: 0.7066 Take profit: 0.7038
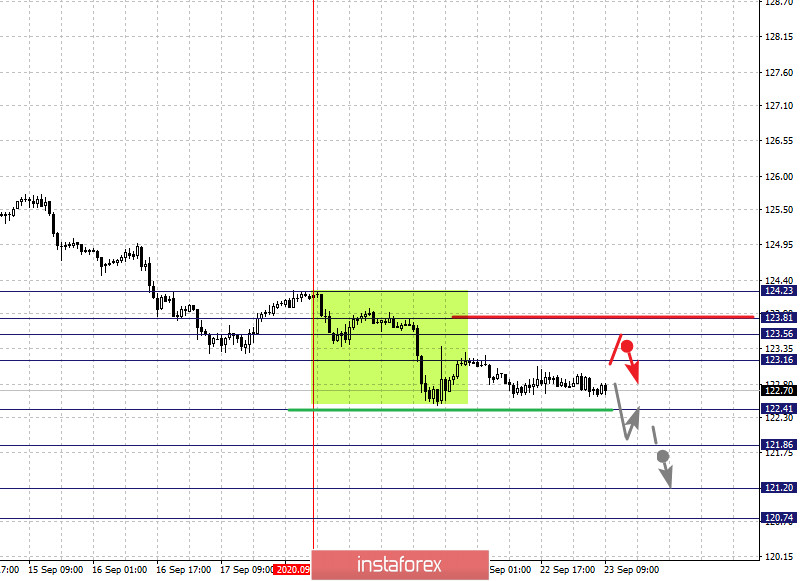
The key levels for the euro/yen pair are 124.23, 123.81, 123.56, 123.16, 122.41, 121.86, 121.20 and 120.74. Here we are following the local descending structure from September 18th. The decline is expected to continue after breaking through the level of 122.41. In this case, the target is 121.86 and there is consolidation near this level. If the target breaks down, it will lead to a sharp decline. Here, our next target is 121.20. For the potential value for the bottom, we consider the level of 120.74. Upon reaching which, we expect consolidation and upward pullback.
Meanwhile, leaving into a correction is expected after the breakdown of 123.16. The target is 123.56, while the range of 123.56 - 123.81 is the key support for the downward structure. The price passing this range will lead to the development of an upward structure. Here, the first potential target is 124.23.
The main trend is the local descending structure of September 18
Trading recommendations:
Buy: 123.16 Take profit: 123.56
Buy: 123.81 Take profit: 124.23
Sell: 122.40 Take profit: 121.88
Sell: 121.84 Take profit: 121.20
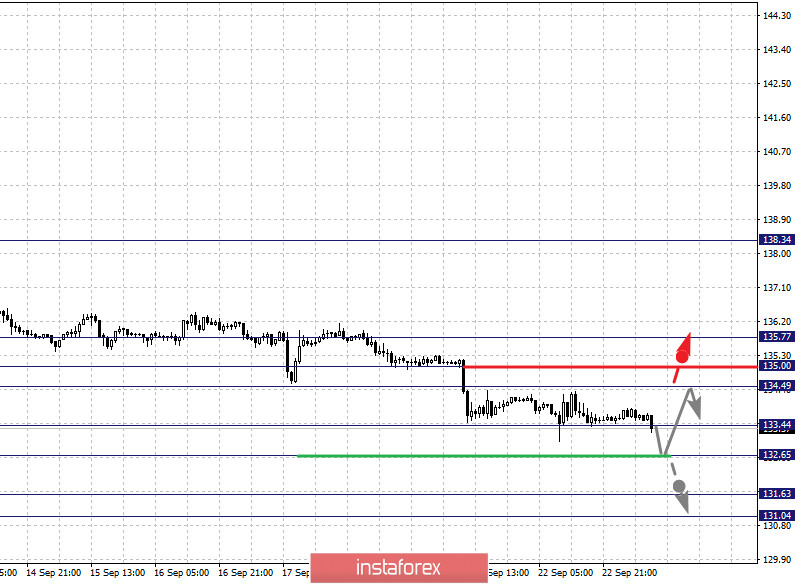
The key levels for the pound/yen pair are 135.77, 135.00, 134.49, 133.44, 132.65, 131.63 and 131.04. We are following the local descending structure from September 10th. Now, a short-term downward movement is expected in the range of 133.44 - 132.65. If the last value breaks down, it will lead to a sharp decline. Here, the target is 131.63. For the potential value for the bottom, we consider the level of 131.04. Upon reaching which, we expect an upward pullback.
A short-term upward movement is expected in the range of 134.49 - 135.00. If the last value breaks down, it will lead to a deep correction. The target here is 135.77, which is the key support for the downward structure.
The main trend is the local descending structure of September 10
Trading recommendations:
Buy: 134.49 Take profit: 135.00
Buy: 135.03 Take profit: 135.75
Sell: 133.44 Take profit: 132.67
Sell: 132.63 Take profit: 131.63
 English
 Русский
 Bahasa Indonesia
 Bahasa Malay
 ไทย
ไทย Español
 Deutsch
 Български
 Français
 Tiếng Việt
 中文
中文 বাংলা
বাংলা हिन्दी
 Čeština
 Українська
 Română

