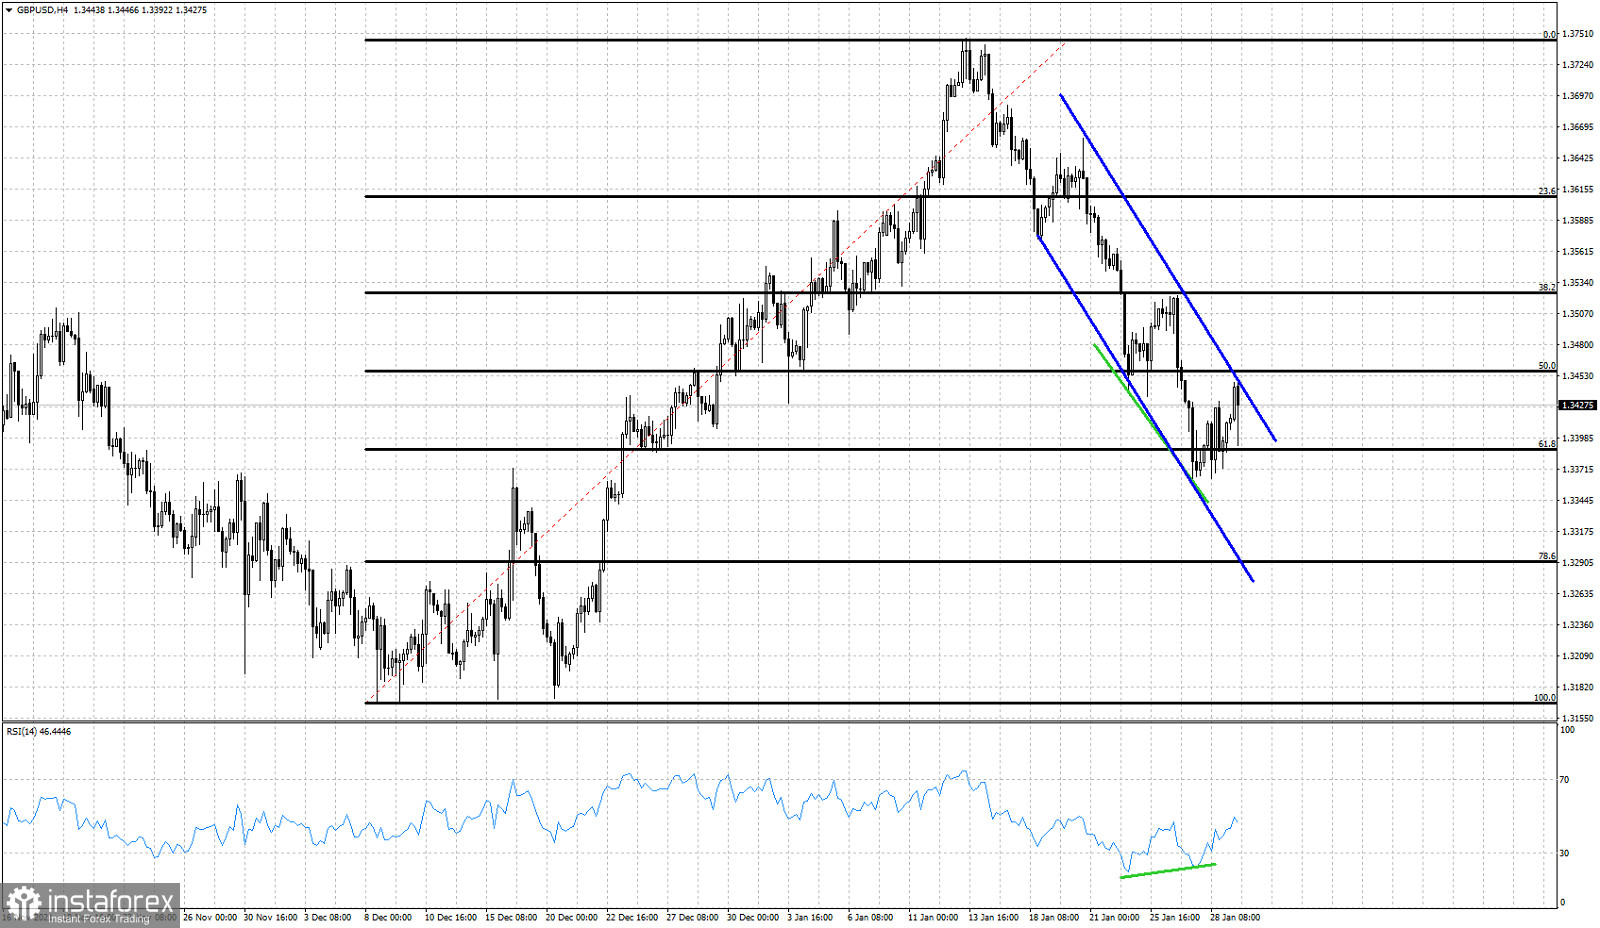
GBPUSD is trading around 1.3430 where we expected to see a bounce. Price remains in a bearish trend making lower lows and lower highs. Price has formed a short-term bearish channel and as long as price is inside it, we continue to expect a new lower low.

Blue lines - bearish channel
Black lines -Fibonacci retracements
GBPUSD has retraced 61.8% of the entire upward movement from 1.3165 to 1.3747. The 61.8% Fibonacci level is key support and a price level where we often see trend reversals. Combined with the bullish divergence signal by the RSI, the chances of a bigger reversal are increasing. The bullish divergence is only a warning and not a reversal sign. A rejection at current levels around 1.3440 will be a bearish sign and will increase chances of seeing a lower low. If the lower low comes and the RSI provides a higher low, then we will start thinking of buying the pull back. A new lower low in price combined with another bullish divergence, would be a bullish signal implying that the downtrend will soon be over as it is weakening.
 English
 Русский
 Bahasa Indonesia
 Bahasa Malay
 ไทย
ไทย Español
 Deutsch
 Български
 Français
 Tiếng Việt
 中文
中文 বাংলা
বাংলা हिन्दी
 Čeština
 Українська
 Română

