 English
  Русский
 Bahasa Indonesia
 Bahasa Malay
 ไทย
ไทย Español
 Deutsch
 Български
 Français
 Tiếng Việt
 中文
中文 বাংলা
বাংলা हिन्दी
 Čeština
 Українська
 Română

Trend analysis.
This week, the price from the level of 1.2912 (closing of the last weekly candle) will decline in order to reach the historical support level 1.2781 (yellow dashed line), and if this line is broken, we can continue further below with the target of the 38.2% - a pullback level of 1.2690 (red dotted line).
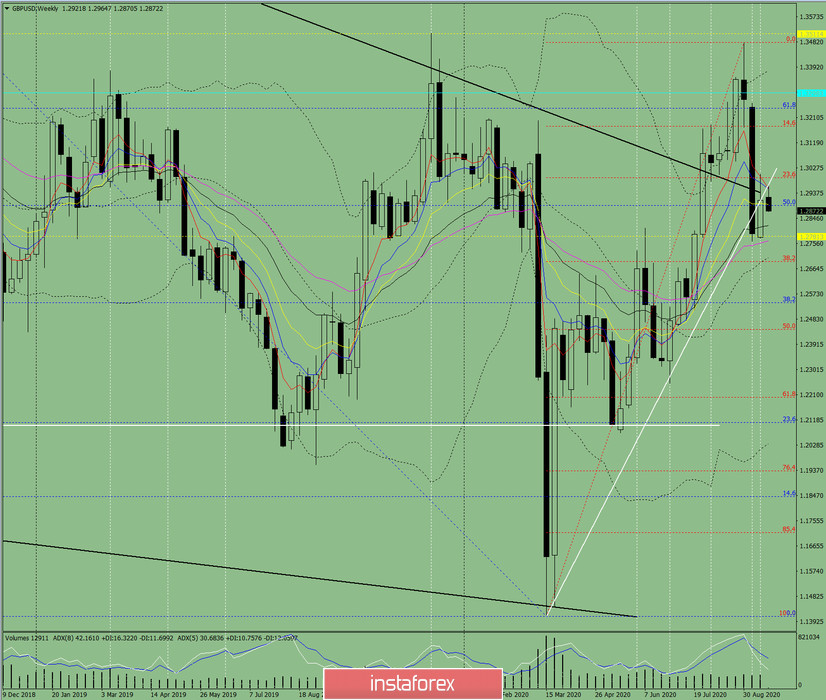
Figure: 1 (weekly chart).
Comprehensive analysis:
- indicator analysis - down;
- Fibonacci levels - down;
- volumes - down;
- candlestick analysis - down;
- trend analysis - down;
- Bollinger lines - down;
- monthly chart - down.
A downward movement can be concluded based on a comprehensive analysis.
The general result of calculating the candlestick of the GBP/USD pair according to the weekly chart: this week's price will most likely have a downward trend without the first upper shadow of the weekly black candlestick (Monday - down) and without the second lower shadow (Friday - down).
The first downside target is to reach the historical support level 1.2781 (yellow dashed line), and if this line is broken, we can continue further below with the target of the 38.2% - a pullback level of 1.2690 (red dotted line).
An unlikely scenario: from the level of 1.2912 (closing of the last weekly candle), the price is unlikely to rise, with the target of the 61.8% - a pullback level of 1.3059 (blue dotted line).