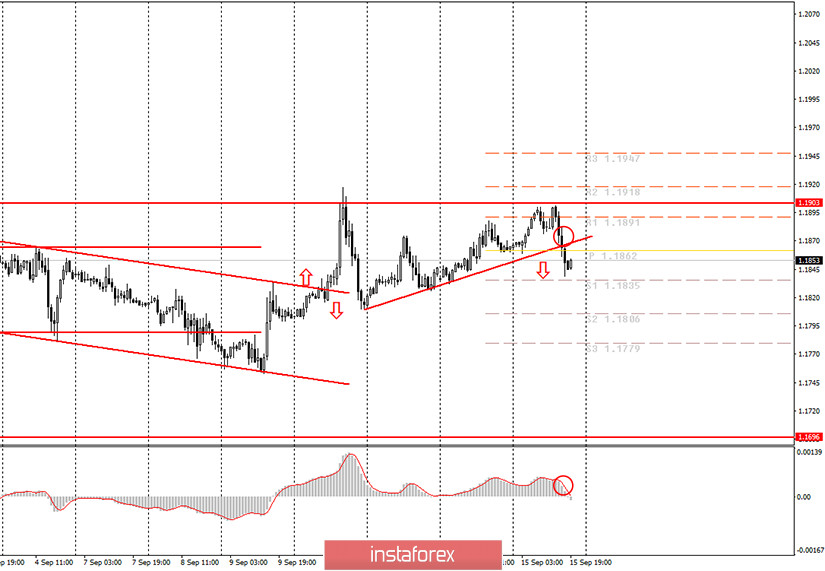
EUR/USD hourly chart

On Tuesday, September 15, the euro/dollar pair continued to trade within the sideways channel of 1.17-1.19. However, the price has been holding in this range for more than a month and a half. In our morning publication, we assumed that the pair would bounce back from the upper boundary of the channel or would simply start a downward movement from the upper area. Therefore, we did not recommend buying the pair despite the fact that there was an upward trend line, and the MACD indicator generated a buy signal. In practice, the bulls once again failed to push the pair above 1.1900, and a new round of downward movement began. The quotes consolidated below the uptrend line, and we saw it as a signal to open sell positions. Thus, novice traders had the opportunity to open short positions today, which should have brought a profit of about 10-12 pips. Unfortunately, the quotes crossed the trend line in the late afternoon, so the pair could have lost the downward momentum. At the same time, the two unsuccessful attempts to break above the level of 1.19 will most likely push the quotes much lower compared to the current levels. Thus, sell orders can be left open at this time.
Fundamentally, the economic calendar was uneventful on Tuesday. Only one important report on US industrial production for July was published during the day. The industrial growth rate turned out to be much lower than expected. However, this data did not seriously affect the US dollars' trajectory. In fact, traders paid more attention to the technical picture which became the basis for a new downtrend in the afternoon.
On Wednesday, September 16, an important event that we have been talking about since Monday will take place: the Fed's meeting and its results. Let us remind novice traders that the Fed is the US central bank which holds 8 regular meetings per year. At these meetings, the policymakers decide on whether to change the monetary policy or leave it unchanged in order to influence the country's economy. Most likely, this time there will be no changes to the monetary policy. However, at a press conference, Fed's Chairman Jerome Powell may give some important clues. In other words, the more Powell talks about a weak economy, a long recovery, and high risks, the more chances that the US dollar will start a new fall. This, in turn, will trigger a rise in the euro/dollar pair. Also, a report on US retail sales will be published on Wednesday which may also affect the trajectory of the pair during the day.
Possible scenarios for September 16:
1) We still do not recommend opening buy deals at this time, as the price has once again failed to break above the level of 1.1903, which is the upper line of the sideways channel. Therefore, the uptrend is again canceled. Also, there is no clear pattern that would support the uptrend now.
2) Sell deals look more relevant at the moment, as traders have failed to break through the level of 1.1903, and the price has consolidated below the uptrend line. Thus, beginners can open short positions now and try to leave them open until the morning with the targets at 1.1835 and 1.1806. Do not forget to set Stop Loss in order to protect yourself from a possible sharp change in the pair's trajectory. In the morning, we suggest re-evaluating the situation and deciding whether to leave short positions open.
On the chart:
Support and Resistance Levels are the Levels that serve as targets when buying or selling the pair. You can place Take Profit near these levels.
Red lines are the channels or trend lines that display the current trend and show in which direction it is better to trade now.
Up/down arrows show where you should sell or buy after reaching or breaking through particular levels.
The MACD indicator consists of a histogram and a signal line. When they cross, this is a signal to enter the market. It is recommended to use this indicator in combination with trend lines (channels and trend lines).
Important announcements and economic reports that you can always find in the economic calendar can seriously influence the trajectory of a currency pair. Therefore, at the time of their release, we recommend trading as carefully as possible or exit the market in order to avoid sharp price fluctuations.
Beginners on Forex should remember that not every single trade has to be profitable. The development of a clear strategy and money management are the key to success in trading over a long period of time.
 English
 Русский
 Bahasa Indonesia
 Bahasa Malay
 ไทย
ไทย Español
 Deutsch
 Български
 Français
 Tiếng Việt
 中文
中文 বাংলা
বাংলা हिन्दी
 Čeština
 Українська
 Română

