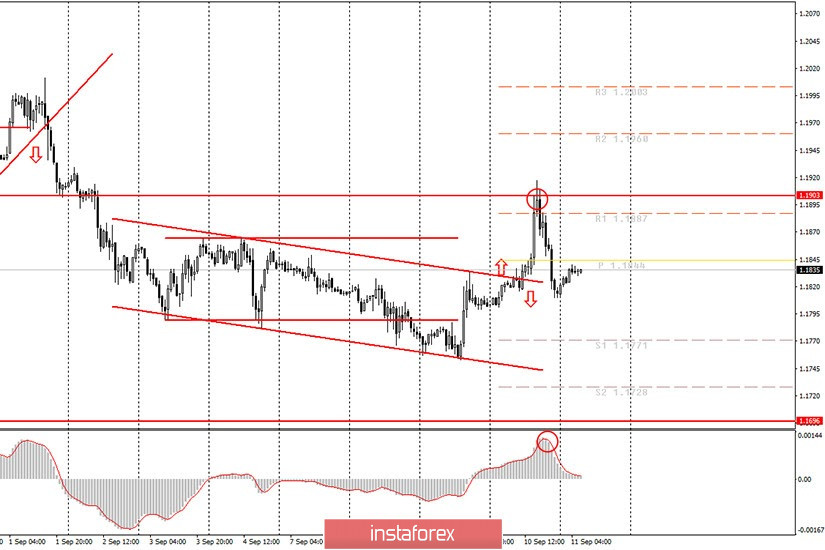
Hourly chart of the EUR/USD pair

The EUR/USD pair, as we expected, almost completely recovered its original positions last night. The ones that the euro/dollar pair had before the European Central Bank meeting. Yesterday we said that, from our perspective, the euro's growth was absolutely unreasonable since the ECB did not say anything optimistic. The same goes for its chairman, Christine Lagarde. Thus, it was self-evident that the euro would fall. Moreover, the quotes reached the upper limit of the sideways channel of 1.17-1.19, which we have been mentioning for several weeks. There have been several attempts to leave this channel, but most of the time quotes still spent some time inside it. Thus, rebounding from the 1.1903 level also triggered a new round of downward movement. However, traders do not have a trend line, a trend channel, or any other technical structure that would support this or that trend. Therefore, novice traders can only assume that the downward movement will continue after rebounding from 1.19.
Novice traders are advised to pay attention to one macroeconomic report on September 11 - US inflation. In recent weeks, inflation has started to become important again, as both the Federal Reserve and the European Central Bank have started talking about it. The central banks of the United States and the European Union are going to focus on inflation indicators when adjusting their monetary policies. Simply put, inflation is the first thing a central bank will pay attention to at its meetings. Both central banks believe inflation should be 2% or slightly higher. But this should be a stable 2%, and not isolated cases. Such inflation was very difficult to achieve even before the coronavirus crisis, and even more so now. Growth in US inflation (if it is recorded today) is good, but we do not expect a significant market reaction to this report. Forecasts say that the core indicator should rise from 1% to 1.2% y/y, while core inflation (excluding volatile food and energy) should remain at 1.6% y/y. Therefore, exceeding these forecasts will be a good thing for the dollar. We also recall that not long ago inflation data came out in the European Union, which reached -0.2% y y in August. That is, in essence, this is deflation, falling prices. No other important macroeconomic reports are scheduled for today.
Possible scenarios for September 11:
1) Novice traders are advised to not consider long deals on the pair at this time, since the price rebounded from 1.1903 yesterday, which is the upper line of the side channel. Also, there is not a single pattern that would support trading for growth at this time. Accordingly, buyers need to wait for an upward trend or set and consolidate the price above the 1.1903 level.
2) Sell positions still look more attractive now, only because traders failed to overcome 1.1903. At the same time, the situation is quite difficult now, if we talk about the possibility of opening new short positions. First, there are no patterns that would support the downward movement. Secondly, even if we assume that the price would go down after rebounding from 1.1903, it would be nice for the MACD indicator to slightly correct up (as well as the price). So far, the indicator is directed down, so it can't generate a new sell signal. Thus, those traders who started selling the pair last night can now remain in short positions with targets of 1.1771 and 1.1728. For new shorts , you need a signal from the MACD.
On the chart:
Support and Resistance Levels are the Levels that serve as targets when buying or selling the pair. You can place Take Profit near these levels.
Red lines are the channels or trend lines that display the current trend and show in which direction it is better to trade now.
Up/down arrows show where you should sell or buy after reaching or breaking through particular levels.
The MACD indicator consists of a histogram and a signal line. When they cross, this is a signal to enter the market. It is recommended to use this indicator in combination with trend lines (channels and trend lines).
Important announcements and economic reports that you can always find in the news calendar can seriously influence the trajectory of a currency pair. Therefore, at the time of their release, we recommended trading as carefully as possible or exit the market in order to avoid a sharp price reversal.
Beginners on Forex should remember that not every single trade has to be profitable. The development of a clear strategy and money management are the key to success in trading over a long period of time.
 English
 Русский
 Bahasa Indonesia
 Bahasa Malay
 ไทย
ไทย Español
 Deutsch
 Български
 Français
 Tiếng Việt
 中文
中文 বাংলা
বাংলা हिन्दी
 Čeština
 Українська
 Română

