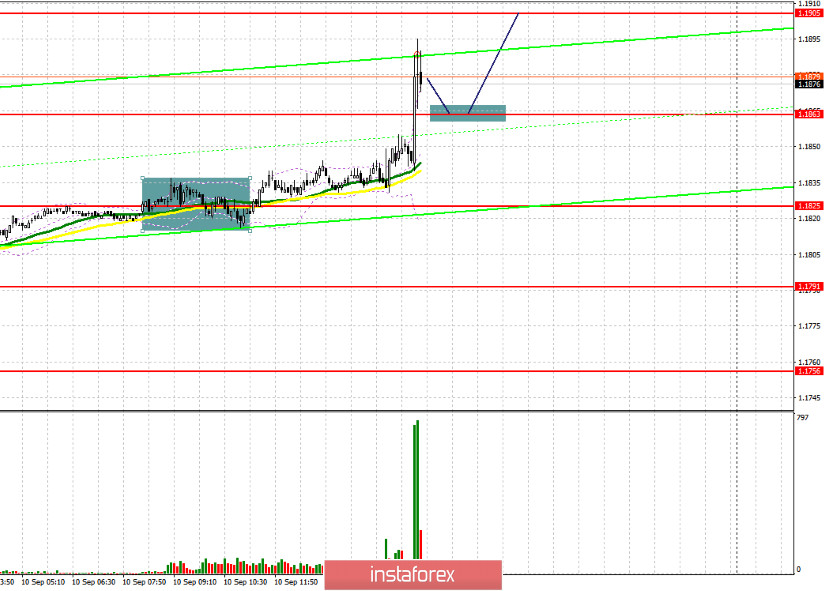
To open long positions on EURUSD, you need:
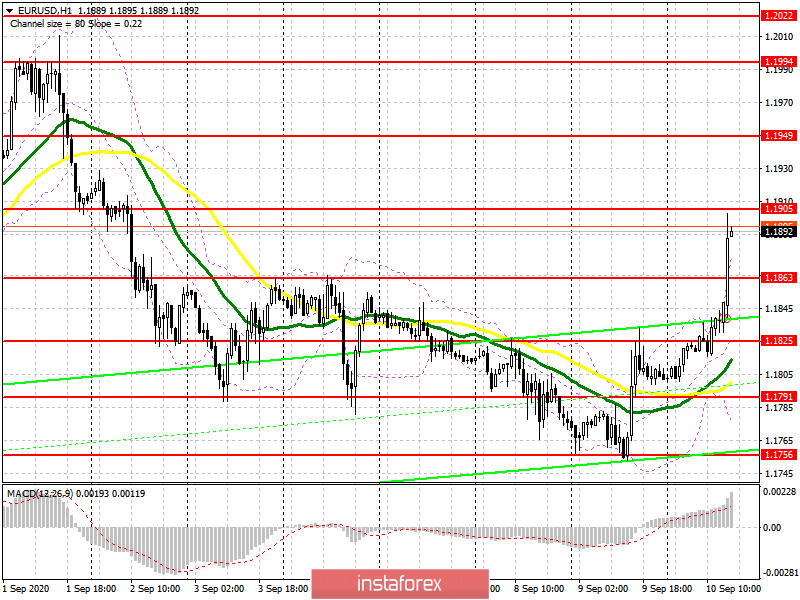
The complete absence of changes in the monetary policy of the European Central Bank, which was feared by euro buyers, led to the formation of a new bull market and now only one thing is required – to consolidate above the maximum of 1.1863. A test of this level from top to bottom forms a good entry point for the continued growth of the European currency. This is marked on the 5-minute chart. The nearest target for buyers of the euro is the resistance of 1.1905, the breakout of which will provide a direct road to the area of the maximum of 1.1949, where I recommend fixing the profits. In the scenario of the pair's decline, and the absence of active purchases in the support area of 1.1863, you can safely open long positions for a rebound from the area of 1.1825, where the moving averages are gradually being pulled up. However, I would not expect a movement of more than 20-30 points from this level.

To open short positions on EURUSD, you need:
After today's meeting of the European Central Bank, sellers will think 10 more times about whether it makes sense to return to short positions at current levels. Most likely, the first attempts to probe the market will be in the resistance area of 1.1905, where the first test of this area may lead to a downward correction of EUR/USD by 15-20 points. If there is no active downward movement from this area, it is best to postpone short positions until the high of 1.1949 is updated and sell the euro from there in the expectation of correction of 30-40 points within the day. An equally important task for the bears will be to close the day below the level of 1.1863, which they missed during the press conference of the President of the European Central Bank, Christine Lagarde. Fixing below 1.1863 may lead to an instant sell-off of the euro to the support area of 1.1825, where I recommend fixing the profits.

Signals of indicators:
Moving averages
Trading is above the 30 and 50 daily moving averages, which indicates the resumption of the bull market for the euro.
Note: The period and prices of moving averages are considered by the author on the hourly chart H1 and differ from the general definition of classic daily moving averages on the daily chart D1.
Bollinger Bands
If the pair declines in the afternoon, the average border of the indicator will act as support in the area of 1.1825, from where you can buy euros immediately for a rebound.
Description of indicators
- Moving average (moving average determines the current trend by smoothing out volatility and noise). Period 50. The graph is marked in yellow.
- Moving average (moving average determines the current trend by smoothing out volatility and noise). Period 30. The graph is marked in green.
- MACD indicator (Moving Average Convergence / Divergence - moving average convergence / divergence) Fast EMA period 12. Slow EMA period 26. SMA period 9
- Bollinger Bands (Bollinger Bands). Period 20
- Non-profit speculative traders, such as individual traders, hedge funds, and large institutions that use the futures market for speculative purposes and meet certain requirements.
- Long non-commercial positions represent the total long open position of non-commercial traders.
- Short non-commercial positions represent the total short open position of non-commercial traders.
- Total non-commercial net position is the difference between the short and long positions of non-commercial traders.
 English
 Русский
 Bahasa Indonesia
 Bahasa Malay
 ไทย
ไทย Español
 Deutsch
 Български
 Français
 Tiếng Việt
 中文
中文 বাংলা
বাংলা हिन्दी
 Čeština
 Українська
 Română

