To open long positions on EUR.USD, you need:
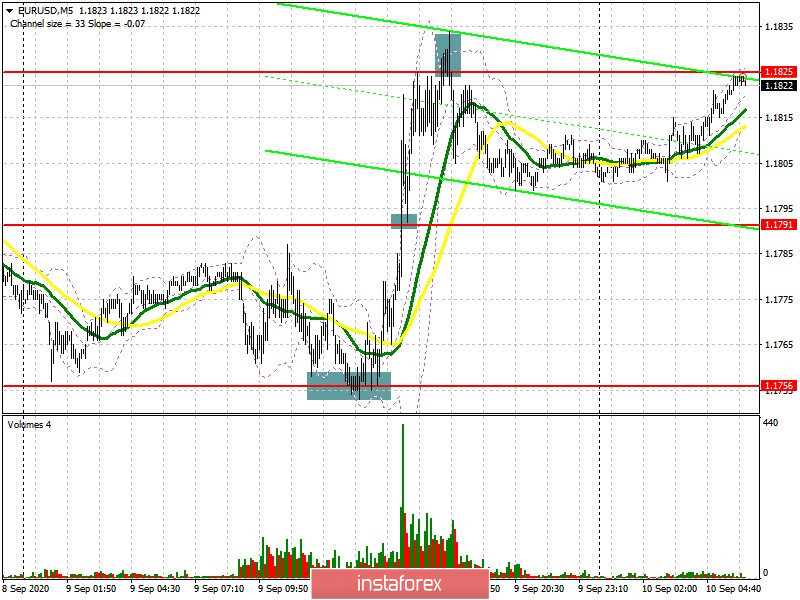
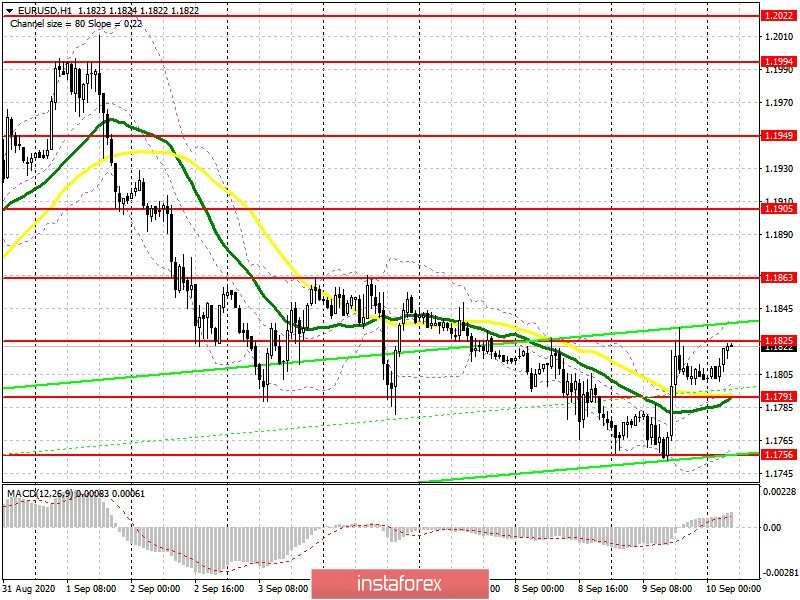
Several signals to enter the market appeared yesterday afternoon. If you remember my forecast, I recommended opening long positions when a false breakout forms in the support area of 1.1756, which happened. The 5-minute chart clearly shows how, after the bears' several unsuccessful attempts to push through 1.1756, the pair returns to this level, afterwards a large rise occurs. But even if you did not have time to enter buy positions on this signal, an excellent point appeared for opening long positions after a breakout and consolidating above the resistance of 1.1791. Being able to return and test this level from top to bottom continued the upward correction in the pair. I recommended selling immediately on a rebound from the resistance of 1.1825, which allowed us to take around 20 points from the market. At the moment, euro buyers need to break through and settle above the 1.1825 level, which creates a signal to open long positions in the hopes of rising to a high of 1.1863, where I recommend taking profits. A breakthrough of this range will entirely depend on the European Central Bank's decision on monetary policy. Strong bullish momentum and the breakout of 1.1863 would open a direct path to the highs of 1.1905 and 1.1949. If the EUR/USD pair is under pressure in the morning, then I recommend returning to long positions after a correction and a false breakout in the support area of 1.1791, where the moving averages are now playing on the side of buyers. In the absence of activity at this level, it is best to postpone purchases until the low of 1.1756 has been updated, counting on a correction of 20-25 points within the day. In case the euro tumbles down after the ECB announces its decision on interest rates, I recommend waiting for an update of the larger lows of 1.1714 and 1.1648 and buy euros from there.
Let me remind you that the Commitment of Traders (COT) reports for September 1 showed a decrease in long non-commercial positions from 262,061 to 250,867, while short non-commercial positions increased from 50,309 to 54,130. The euro rose to new annual highs and the bulls' inability to break through the area above the 20th figure, which we clearly saw at the beginning of this month, led to a significant closure of long positions and profit taking by traders as well as a build-up of short ones. As a result, the positive non-commercial net position slightly decreased and reached 196,747, against 211,752 a week earlier. However, any major decline in the euro will be seen by traders as a good level to build up long positions in the medium term.

To open short positions on EUR/USD, you need:
The bears will count on the ECB to make changes in the monetary policy, or at least hints to do so in the near future, which will weaken the euro's position. Forming a false breakout in the resistance area of 1.1825 in the first half of the day will be the first signal for the euro to break through in order to return to 1.1791 at the middle of the side channel. Settling below this level will increase the pressure on the pair, which will lead to a retest of the lower limit of the 1.1756 channel, its breakout will completely depend on the ECB's decisions and forecasts. Consolidating below this range would open a direct road to the lows of 1.1714 and 1.1648. If the bulls continue to push the pair up and the bears can not cope with protecting resistance at 1.1825, then it is best not to rush to sell, but wait until the 1.1863 high has been updated and a false breakout forms there, or you can sell EUR/USD immediately on a rebound from the larger resistance at 1.1905, counting on correction of 20-30 points within the day.

Indicator signals:
Moving averages
Trading is carried out slightly above 30 and 50 moving averages, which indicates an upward correction for the euro.
Note: The period and prices of moving averages are considered by the author on the H1 hourly chart and differs from the general definition of the classic daily moving averages on the D1 daily chart.
Bollinger Bands
A breakout of the upper border of the indicator around 1.1830 will lead to a new wave of euro growth. In case the pair falls, support will be provided by the lower border of the indicator in the 1.1755 area.
Description of indicators
- Moving average (moving average, determines the current trend by smoothing out volatility and noise). Period 50. It is marked in yellow on the chart.
- Moving average (moving average, determines the current trend by smoothing out volatility and noise). Period 30. It is marked in green on the chart.
- MACD indicator (Moving Average Convergence/Divergence — convergence/divergence of moving averages) Quick EMA period 12. Slow EMA period to 26. SMA period 9
- Bollinger Bands (Bollinger Bands). Period 20
- Non-commercial speculative traders, such as individual traders, hedge funds, and large institutions that use the futures market for speculative purposes and meet certain requirements.
- Long non-commercial positions represent the total long open position of non-commercial traders.
- Short non-commercial positions represent the total short open position of non-commercial traders.
- Total non-commercial net position is the difference between short and long positions of non-commercial traders.
 English
 Русский
 Bahasa Indonesia
 Bahasa Malay
 ไทย
ไทย Español
 Deutsch
 Български
 Français
 Tiếng Việt
 中文
中文 বাংলা
বাংলা हिन्दी
 Čeština
 Українська
 Română

