The final data on Eurozone GDP for the second quarter published yesterday were better than expected, however, this did not prevent the single European currency from continuing to decline against the US dollar. At the moment, the pressure on the euro is exerted by two main factors. The first is the high probability that at tomorrow's press conference of the President of the European Central Bank (ECB) Christine Lagarde, a hint or announced new incentives will be given. The second factor putting pressure on the euro is the high probability of the UK leaving the European Union without a deal. It should be noted that this pressure is not as strong as the British currency is experiencing, however, it is taking place.
We immediately proceed to the technical analysis of the main currency pair since the economic calendars of the Eurozone and the United States today are empty.
Daily

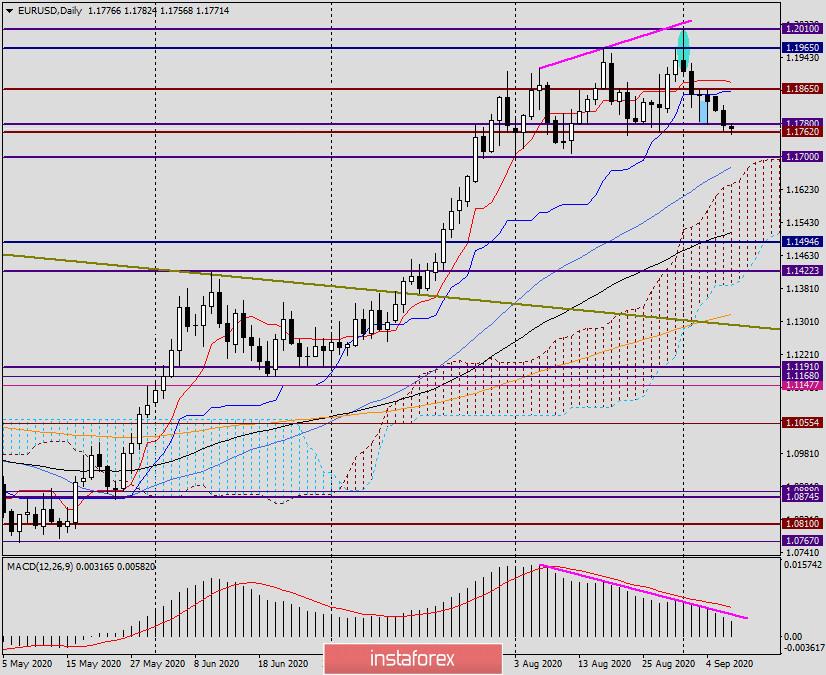
As a result of yesterday's decline, trading closed below one of the key support levels of 1.1780, which became a significant prerequisite for the EUR/USD bears to continue pressure on the quote. This is exactly what happens at the moment of writing. The pair is trying to break through another important support level of 1.1762, which is still holding back the sellers' pressure. If today's session closes not only below 1.1762 but also below 1.1753, this will further strengthen the position of the bears and send them to test the key level of 1.1700. If a bullish candlestick analysis model appears, we can expect a corrective pullback to the price zone of 1.1860-1.1883. As you can see, the resistance level of 1.1865 passes here, as well as the Tenkan and Kijun lines of the Ichimoku indicator. It is too early to talk about further goals at the top. The pair is under selling pressure, and the main scenario is seen as a downward one.
H4

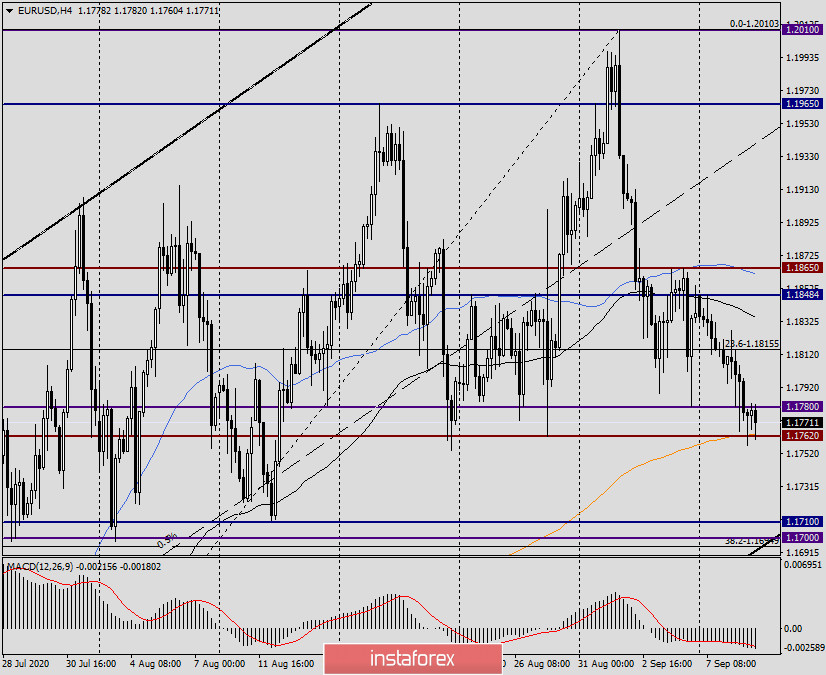
On the four-hour 200 timeframes, the exponential moving average provided strong support to the price. Attempts to break through the 200 EMA do not lead to anything, and the long lower shadows of candles can be perceived as a preparation for growth, rather a corrective one. If the current candle turns out to have a long lower shadow, you can try to buy EUR/USD with the nearest target at 1.1835, where the black 89 exponential moving average runs. In the case of a breakdown of the 200 EMA, you can try opening sales with a target in the area of 1.1710-1.1700. Since there are two support levels and the lower border of the ascending channel, I recommend opening long positions for the pair when the corresponding signals appear in the selected area.
In my opinion, the 200 EMA will still hold the price and will not be broken, so those who trade aggressively and riskily can try buying the pair from current prices. As for sales, they look good from 1.1805, 1.1815, 1.1835, and 1.1860. I believe that before the results of the ECB meeting and especially the press conference of Christine Lagarde, we can consider positioning in both directions, however, it is better not to set big goals yet.
 English
 Русский
 Bahasa Indonesia
 Bahasa Malay
 ไทย
ไทย Español
 Deutsch
 Български
 Français
 Tiếng Việt
 中文
中文 বাংলা
বাংলা हिन्दी
 Čeština
 Українська
 Română

