GBP/USD
Analysis:
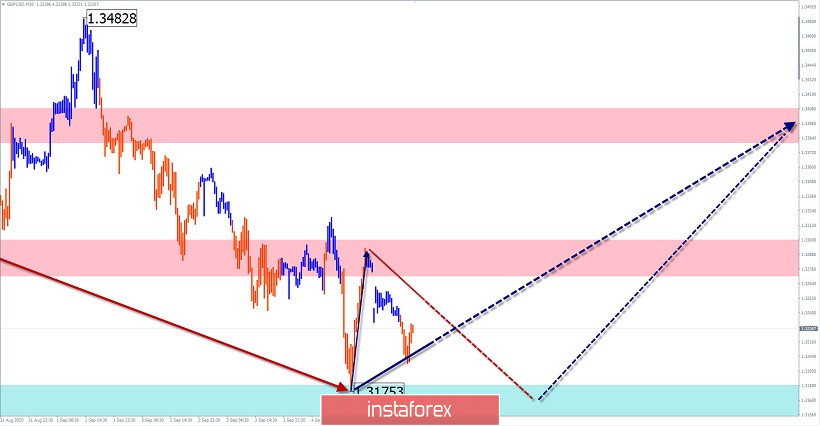
The scale of the current upward trend of the British pound is approaching the weekly timeframe. The pair's quotes are in the zone of a potential reversal. The unfinished section of the wave started on August 21. In recent days, the price has been adjusted to the previously broken level.
Forecast:
Today, the end of the downward price movement, the formation of a reversal, and the beginning of a price rise are expected. The ascending stage is possible at the end of the day or tomorrow.
Potential reversal zones
Resistance:
- 1.3380/1.3410
- 1.3270/1.3300
Support:
- 1.3180/1.3150
Recommendations:
It is not recommended to sell the British pound today since it is too risky. To enter into long positions, you need to pay attention to the reversal signals.

AUD/USD
Analysis:
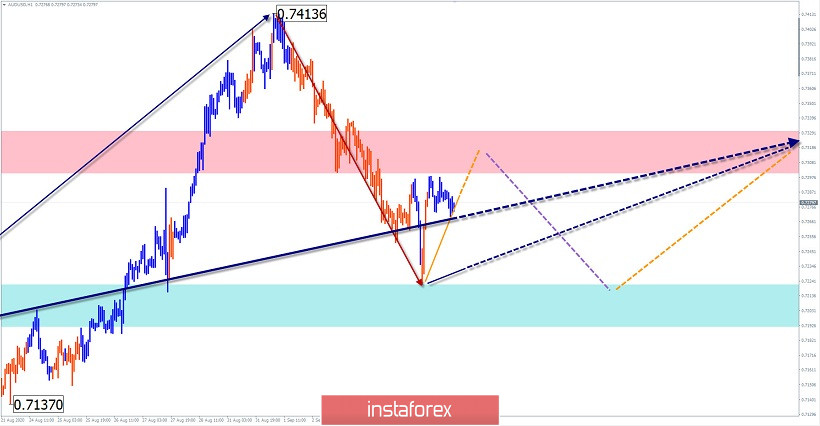
On the chart of the Australian dollar, the upward movement of the instrument continues for more than six months. The wave has a pronounced impulse type of development. The last section has been reporting since August 20. Over the past week, its quotes formed a pullback, which is close to completion.
Forecast:
Today, the price is expected to move in a sideways corridor between the nearest counter zones. In the next session, a downward vector is more likely. By the end of the day, you can expect a change in the exchange rate and a price increase in the resistance area.
Potential reversal zones
Resistance:
- 0.7300/0.7330
Support:
- 0.7220/0.7190
Recommendations:
There are no conditions for selling the Australian dollar. It is recommended to look for signals to buy the instrument at the end of all oncoming traffic.

EUR/JPY
Analysis:
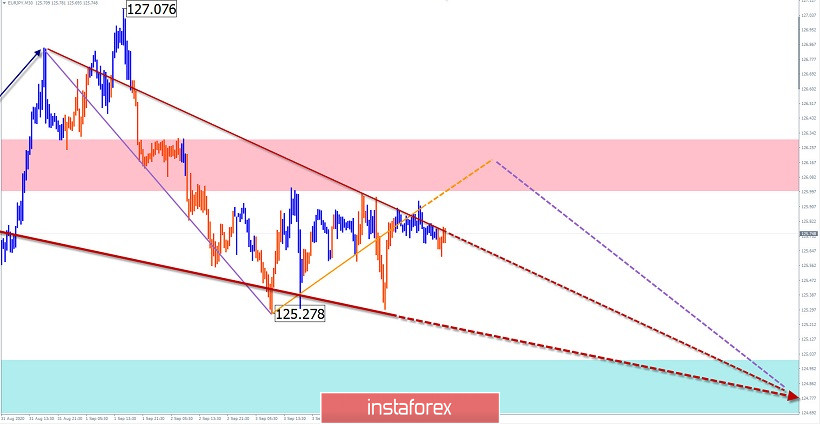
The European cross chart has been dominated by a downward trend in recent years. Since May of this year, the price has been adjusted. Quotes have reached the zone of a potential reversal. The last wave section has been reporting since August 13. There is a clear zigzag in its structure. The structure lacks the final part.
Forecast:
Today, the price is expected to move mainly in the lateral plane. In the first half of the day, a downward movement is possible up to the calculated support. By the end of the day, you can expect a reversal and price growth to the upper border of the corridor.
Potential reversal zones
Resistance:
- 126.00/126.30
Support:
- 125.00/124.70
Recommendations:
According to the expected sequence, trading on the cross-market today is possible within the intraday. It is better to lower the trading lot. Sales are riskier.

Explanation: In the simplified wave analysis (UVA), waves consist of 3 parts (A-B-C). The last incomplete wave is analyzed. The solid background of the arrows shows the formed structure, and the dotted one shows the expected movements.
Note: The wave algorithm does not take into account the duration of the tool's movements in time!
 English
 Русский
 Bahasa Indonesia
 Bahasa Malay
 ไทย
ไทย Español
 Deutsch
 Български
 Français
 Tiếng Việt
 中文
中文 বাংলা
বাংলা हिन्दी
 Čeština
 Українська
 Română

