Outlook on September 7:
Analytical overview of currency pairs on the H1 scale:
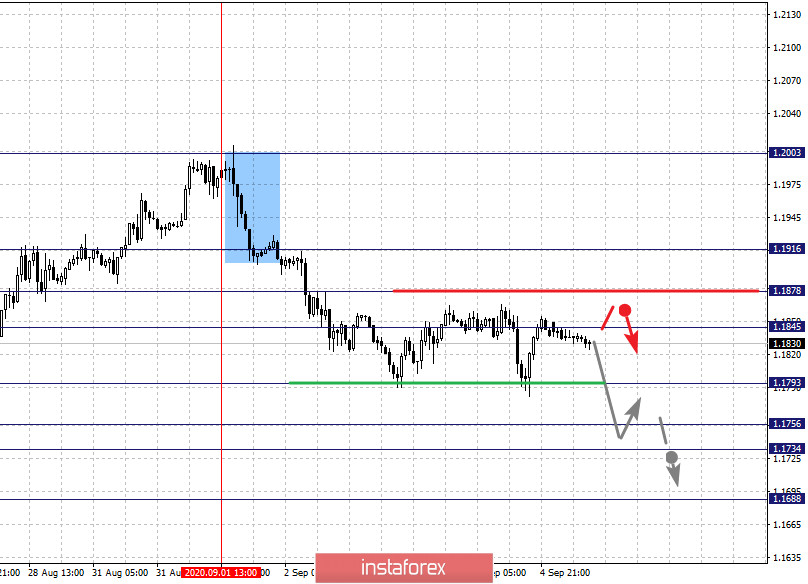
The key levels for the euro/dollar pair on the H1 chart are 1.1878, 1.1845, 1.1825, 1.1793, 1.1756, 1.1734 and 1.1688. We are following the development of the downtrend cycle on September 1. Here, the decline is expected to continue after the breakdown of 1.1793. In this case, the target is 1.1756. Meanwhile, there is a short-term downward movement and consolidation in the range of 1.1756 - 1.1734. We consider the level of 1.1688 as a potential value for the bottom. Upon reaching which, an upward pullback can be expected.
A short-term upward movement is possible in the range of 1.1845 - 1.1878, breaking through the last value will encourage the formation of potential initial conditions. The target is 1.1916.
The main trend is the downward cycle from September 1
Trading recommendations:
Buy: 1.1847 Take profit: 1.1876
Buy: 1.1880 Take profit: 1.1914
Sell: 1.1790 Take profit: 1.1757
Sell: 1.1754 Take profit: 1.1735
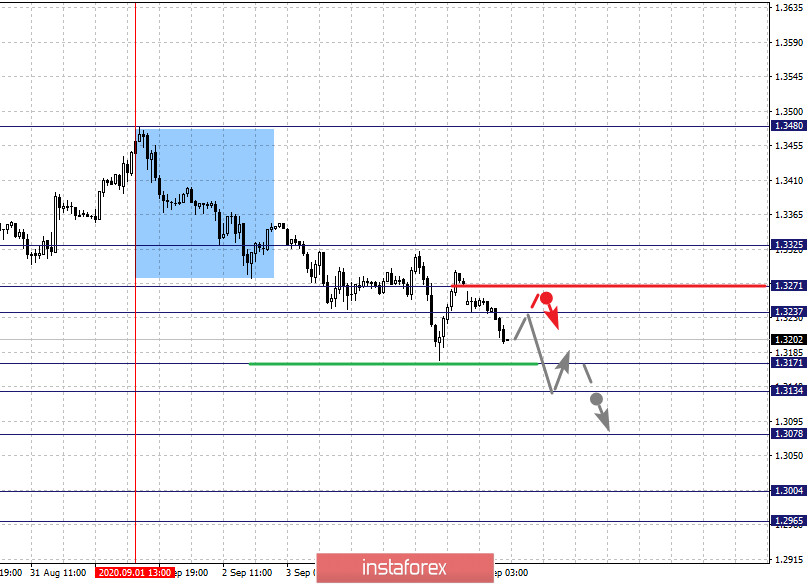
The key levels for the pound/dollar pair are 1.3325, 1.3271, 1.3237, 1.3171, 1.3134, 1.3078, 1.3004 and 1.2965. The descending structure from September 1st is being followed here. Now, a short-term downward movement is expected in the range of 1.3171 - 1.3134, breaking through the last value should be accompanied by a strong downward movement to the level of 1.3078. A consolidation is near this level. The breakdown of the level of 1.3076 will lead to a movement to a potential target - 1.3004. On the other hand, price consolidation and upward pullback is considered in the range of 1.3004 - 1.2965.
A short-term upward movement is expected in the range of 1.3237 - 1.3271. If the last value breaks down, a deep correction is likely. Here, the target is 1.3325, which is the key support for the downward structure.
The main trend is the descending structure from September 1.
Trading recommendations:
Buy: 1.3237 Take profit: 1.3270
Buy: 1.3274 Take profit: 1.3325
Sell: 1.3171 Take profit: 1.3135
Sell: 1.3132 Take profit: 1.3080
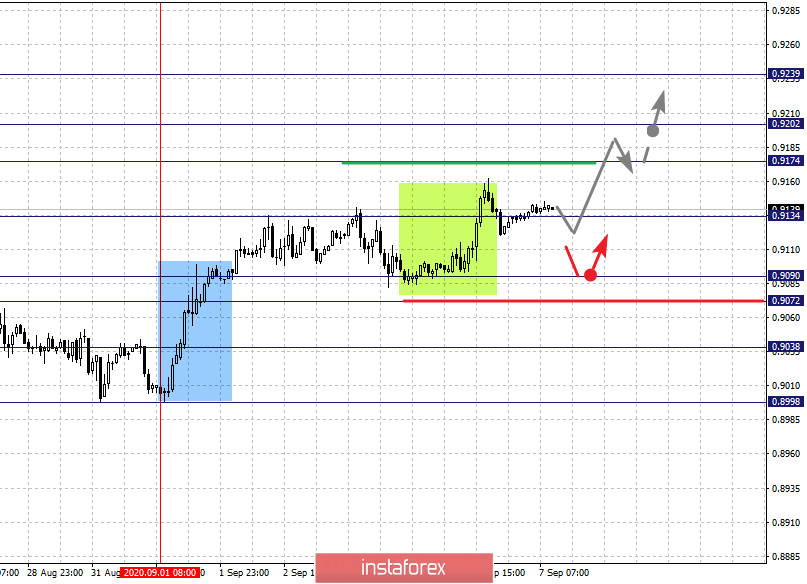
The key levels for the dollar/franc pair are 0.9239, 0.9202, 0.9174, 0.9134, 0.9090, 0.9072, 0.9038 and 0.8998. Here, we are following the upward structure from September 1. The upward movement, in turn, is expected to continue after the breakdown of 0.9134. In this case, the target is 0.9174. There is a short-term upward movement and consolidation in the range of 0.9174 - 0.9202. Now, we consider the level 0.9239 as a potential value for the top. Upon reaching which, we expect a downward pullback.
A short-term decline is possible in the range of 0.9090 - 0.9072. If the last value breaks down, a deep correction will emerge. Here, the potential target is 0.9038, which is the key support level for the top.
The main trend is the upward structure from September 1
Trading recommendations:
Buy : 0.9134 Take profit: 0.9174
Buy : 0.9176 Take profit: 0.9202
Sell: 0.9090 Take profit: 0.9072
Sell: 0.9070 Take profit: 0.9040
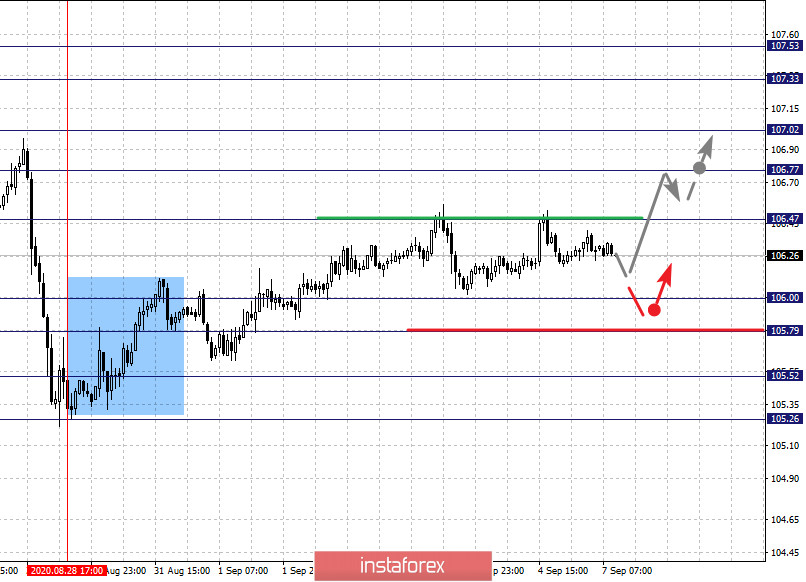
The key levels for the dollar/yen pair are 107.53, 107.33, 107.02, 106.77, 106.47, 106.47, 106.00, 105.79 and 105.52. We are following the upward structure from August 28. Now, the upward movement is expected to continue after the breakdown of the level of 106.47. In this case, the target is 106.77. There is a short-term upward movement and consolidation in the range of 106.77 - 107.02. If the last value breaks down, it will allow us to count on a movement to the potential target - 107.33. Upon reaching which, consolidation in the range 107.33 - 107.53, as well as a key reversal into the correction are expected.
A short-term downward movement is possible in the range of 106.00 - 105.79, breaking through the last value will lead to a deep correction. Here, the target is 105.52, which is the key resistance for the following development of a downward trend.
The main trend is the upward structure from August 28.
Trading recommendations:
Buy: 106.48 Take profit: 106.77
Buy : 106.78 Take profit: 107.00
Sell: 106.00 Take profit: 105.80
Sell: 105.76 Take profit: 105.52
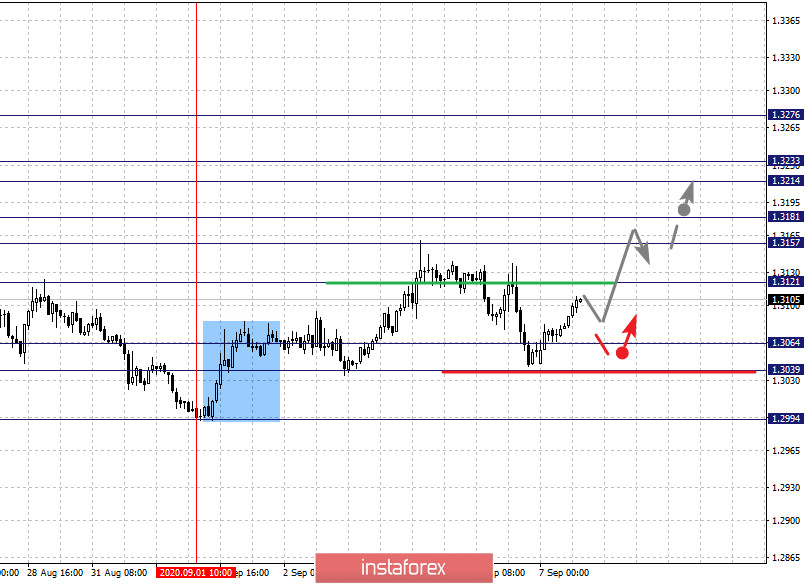
The key levels for the USD/CAD pair are 1.3276, 1.3233, 1.3214, 1.3181, 1.3157, 1.3121, 1.3064, 1.3039 and 1.2994. Here, we are following the development of the upward cycle from September 1. The upward movement is expected to continue after the breakdown of 1.3121. In this case, the first target is 1.3157. As for the short-term upward movement, we expect it in the range 1.3157 - 1.3181, breaking through the last value will lead to a strong upward movement. Here, the target is 1.3214. There is consolidation in the range of 1.3214 - 1.3233. On the other hand, we consider the level of 1.3276 as a potential value for the top. Upon reaching which, we expect a downward pullback.
A short-term downward movement is possible in the range of 1.3064 - 1.3039, which is the key support for the top. The price passing through this will encourage the development of a downward movement. In this case, the potential target is 1.2994.
The main trend is the upward cycle from September 1
Trading recommendations:
Buy: 1.3121 Take profit: 1.3157
Buy : 1.3182 Take profit: 1.3214
Sell: 1.3064 Take profit: 1.3040
Sell: 1.3037 Take profit: 1.2996
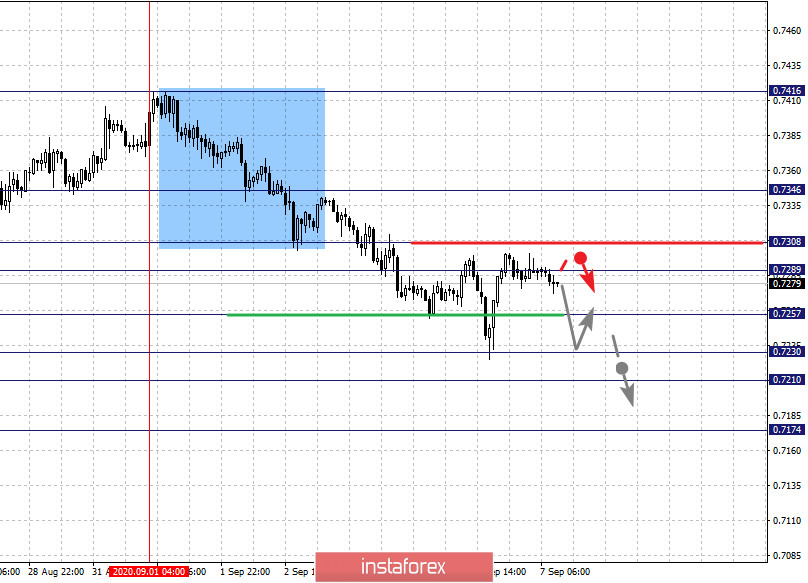
The key levels for the AUD/USD pair are 0.7346, 0.7308, 0.7289, 0.7257, 0.7230, 0.7210 and 0.7174. We are following the development of the downward trend cycle from September 1. Here, the downward movement is expected to continue after the breakdown of 0.7257. In this case, the target is -0.7230. There is a short-term downward movement and consolidation in the range of 0.7230 - 0.7210. For the potential value for the bottom, we consider the level of 0.7174, the movement to which is expected after the breakdown of the level of 0.7210.
A short-term upward movement is expected in the range of 0.7289 - 0.7308. Now, breaking through the last value will lead to a deep correction. The target is 0.7346, which is the support level for the bottom.
The main trend is the descending structure from September 1
Trading recommendations:
Buy: 0.7289 Take profit: 0.7306
Buy: 0.7310 Take profit: 0.7344
Sell : 0.7255 Take profit : 0.7230
Sell: 0.7228 Take profit: 0.7210
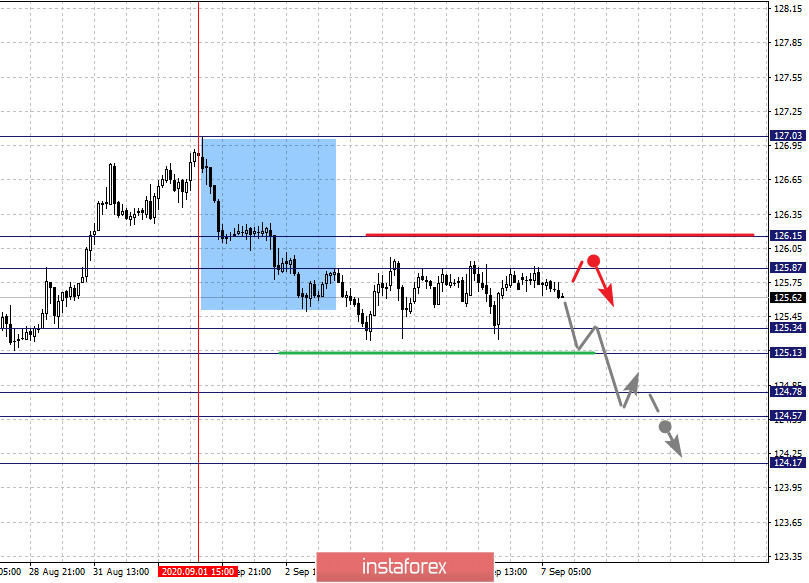
The key levels for the euro/yen pair are 126.15, 125.87, 125.34, 125.13, 124.78, 124.57 and 124.17. We are following the descending structure from September 1st here. Now, a short-term downward movement is expected in the range of 125.34 - 125.13, breaking through the last value should be accompanied by a strong decline. Here, the target is 124.78. On the other hand, there is a short-term downward movement and consolidation in the range of 124.78 - 124.57. We consider the level 124.17 as a potential value for the bottom, from which we expect an upward pullback.
A short-term upward movement is expected in the range of 125.87 - 126.15. If the last value breaks down, it will encourage the formation of initial conditions for an upward cycle. In this case, the targets have not yet been determined.
The main trend is the downward cycle from September 1
Trading recommendations:
Buy: 125.87 Take profit: 126.13
Buy: Take profit:
Sell: 125.13 Take profit: 124.78
Sell: 124.55 Take profit: 124.18
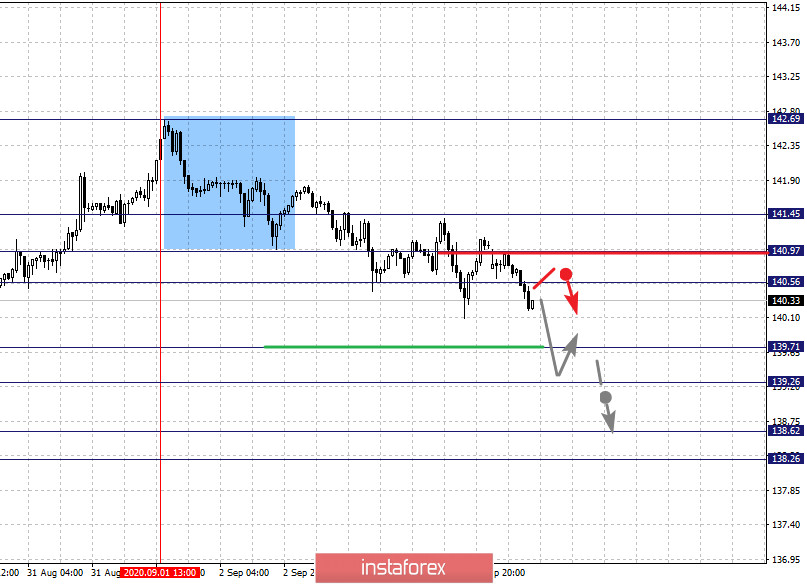
The key levels for the pound/yen pair are 141.45, 140.97, 140.56, 139.71, 139.26, 138.62 and 138.26. We are following the descending structure from September 1st here. At the moment, a movement to the level of 139.71 is expected. Meanwhile, a short-term downward movement, as well as consolidation is in the range of 139.71 - 139.26. The breakdown of the level of 139.26 should be accompanied by a strong downward movement to the 138.62 level. For the potential value for the bottom, we consider the level 138.26, from which we expect an upward pullback.
A short-term upward movement is possible in the range of 140.56 - 140.97. If the last value breaks down, there will be a deep correction. Here, the target is 141.45, which is the key support for the downward structure.
The main trend is the descending structure from September 1
Trading recommendations:
Buy: 140.56 Take profit: 140.95
Buy: 141.00 Take profit: 141.45
Sell: 139.70 Take profit: 139.30
Sell: 139.24 Take profit: 138.70
 English
 Русский
 Bahasa Indonesia
 Bahasa Malay
 ไทย
ไทย Español
 Deutsch
 Български
 Français
 Tiếng Việt
 中文
中文 বাংলা
বাংলা हिन्दी
 Čeština
 Українська
 Română

