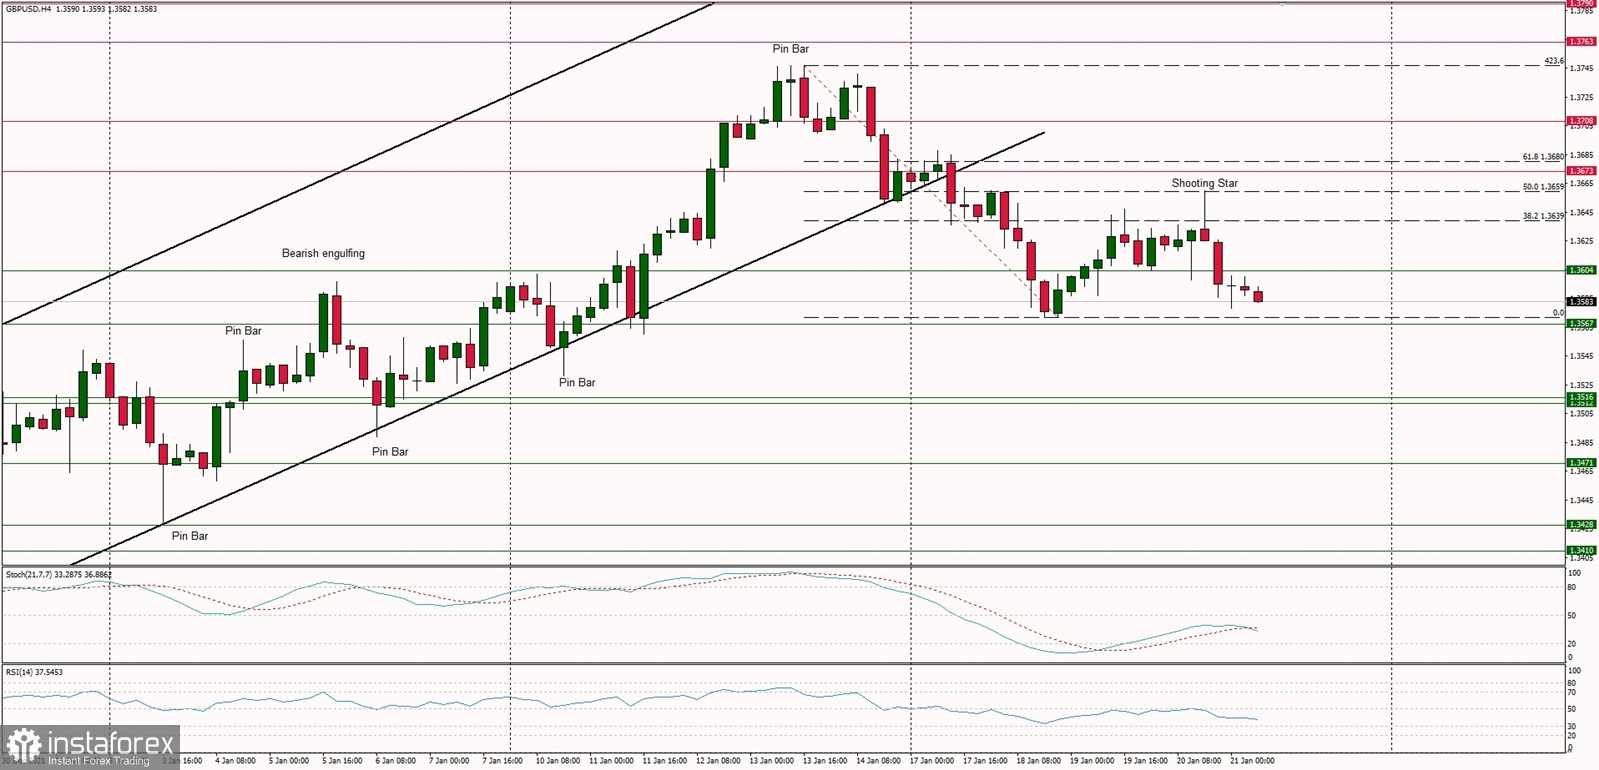
Technical Market Outlook
The GBP/USD pair has been rejected from the 50% Fibonacci retracement level located at 1.3659 ( Shooting Star candlestick formation of the H4 time frame chart at this level). The next target for bears is this week low located at the level of 1.3572. In a case of a breakout lower, the nearest technical support are 1.3567 and 1.3516. The momentum is weak and negative, but the market conditions on the H4 time frame chart are bouncing from the extremely oversold conditions. On the larger time frame charts, like daily and weekly, the up trend is still being continued.
Weekly Pivot Points:
WR3 - 1.3997
WR2 - 1.3859
WR1 - 1.3773
Weekly Pivot - 1.3654
WS1 - 1.3552
WS2 - 1.3440
WS3 - 1.3332
Trading Outlook:
The up trend is being continued, but the up move might be terminated due to the Shooting Star candlestick pattern made at the daily time frame chart at the level of 1.3717. The overall move from the level of 1.3170 looks like a V-shape reversal pattern, so in the long-term the trend might be about to change from the multi-month down trend to the up trend. Please keep an eye on the level of 1.3500, because any sustained breakout below this level will change the outlook back to the bearish again.

 English
 Русский
 Bahasa Indonesia
 Bahasa Malay
 ไทย
ไทย Español
 Deutsch
 Български
 Français
 Tiếng Việt
 中文
中文 বাংলা
বাংলা हिन्दी
 Čeština
 Українська
 Română

