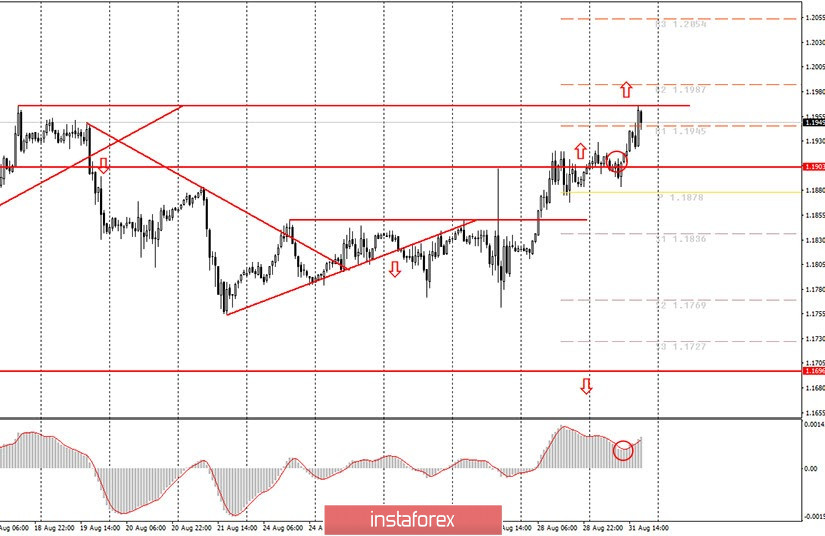
Hourly chart of the EUR/USD pair

The EUR/USD pair resumed its upward movement on Monday, August 31, without any noticeable correction after a fairly strong growth on Thursday and Friday. The MACD indicator turned up, but it turned back when the upward movement was almost over. This happens when the indicator turns too far from the zero mark. Thus, a formal buy signal had formed today, but it was extremely inconvenient and impractical to work it out, especially for novice traders. Moreover, there are still no patterns or graphical figures that identify the current trend as an upward trend and support it. That is, in fact, we have an upward movement, but this movement is not supported by a trend line or channel, which again complicates the trading process. By the end of the trading day, the euro/dollar pair rose to the 1.1967 level, which is the previous local high. Both price peaks are connected by a red horizontal line and now form a resistance line. Formally, we can build an upward trend line through the lows of August 27 and 31, but in this case we will get a trend line that is excessively directed up. The first noticeable correction will lead to the fact that the quotes will settle below such a trend line, which may not mean the end of the upward movement. In general, the technical picture is now ambiguous and complex.
There were almost no macroeconomic events on Monday. As we wrote in this morning's article, market participants were not interested in consumer price indices in Spain, Italy and Germany, as well as Italian GDP for the second quarter. Although inflation in Germany was below forecasts, as well as GDP in Italy, nevertheless, the European currency became more expensive during the day. When it would be much more logical to see a correction. But what can we do if the demand for the US dollar remains almost zero...
September 1, Tuesday, will be more interesting in terms of macroeconomic statistics. First, the European Union will publish inflation for August (preliminary value). Second, the European Union will publish the unemployment rate for July. Third, the US will release a fairly important index of business activity in the manufacturing sector ISM. We believe that traders will not pay much attention to the inflation data, since this is only a preliminary value, and the inflation indicator itself is not important at this time. The unemployment rate will only attract attention if it is radically different from the forecast(8%). Therefore, we recommend paying attention to the ISM index, which may significantly decrease compared to the July value.
Possible scenarios for September 1:
1) Novice traders are not recommended to buy the pair at this time, since there are currently no new patterns that support the upward movement. Thus, to buy the pair, you need to wait for a trend line to form as well as the corresponding buy signals from the MACD. Even overcoming the 1.1967 level does not guarantee that the upward movement will continue, but in this case, novice traders, if there is a signal to buy from the MACD, can still try to open longs while aiming for 1.2054 (to be clarified in the morning). The problem is that the MACD indicator should be sufficiently discharged and also fall to the zero level area to form a good buy signal. And at the same time, a rebound from the 1.1967 level will mean the possible end of the upward movement.
2) We also do not recommend considering sales right now, because there are currently no patterns that support the downward movement either. Theoretically, a rebound from the 1.1967 level can trigger a downward movement, but you can not be completely certain about this. Thus, we recommend that novice traders behave very carefully in the next few days.
On the chart:
Support and Resistance Levels are the Levels that serve as targets when buying or selling the pair. You can place Take Profit near these levels.
Red lines are the channels or trend lines that display the current trend and show in which direction it is better to trade now.
Up/down arrows show where you should sell or buy after reaching or breaking through particular levels.
The MACD indicator consists of a histogram and a signal line. When they cross, this is a signal to enter the market. It is recommended to use this indicator in combination with trend lines (channels and trend lines).
Important announcements and economic reports that you can always find in the news calendar can seriously influence the trajectory of a currency pair. Therefore, at the time of their release, we recommended trading as carefully as possible or exit the market in order to avoid a sharp price reversal.
Beginners on Forex should remember that not every single trade has to be profitable. The development of a clear strategy and money management are the key to success in trading over a long period of time.
 English
 Русский
 Bahasa Indonesia
 Bahasa Malay
 ไทย
ไทย Español
 Deutsch
 Български
 Français
 Tiếng Việt
 中文
中文 বাংলা
বাংলা हिन्दी
 Čeština
 Українська
 Română

