Quite an interesting and much-loved pair of North American dollars has recently somehow fallen out of our sight. Today, we will analyze this tool and focus on the technical picture of USD/CAD. However, before this, it is necessary to highlight the macroeconomic reports, which will be received in large numbers today from Canada and the United States.
So, at 13:30 (London time), Canada will present GDP data for June and for the second quarter. At the same time, reports on personal income and spending of Americans will be released, as well as the basic index of prices for personal consumption expenditures in the United States. At 14:45 (London time), the Chicago purchasing managers' index will be presented, and at 15:00 (London time), the consumer sentiment index from the University of Michigan will be presented. This is a fairly busy day with macroeconomic statistics. But will it affect the final balance of power for USD/CAD?
Weekly

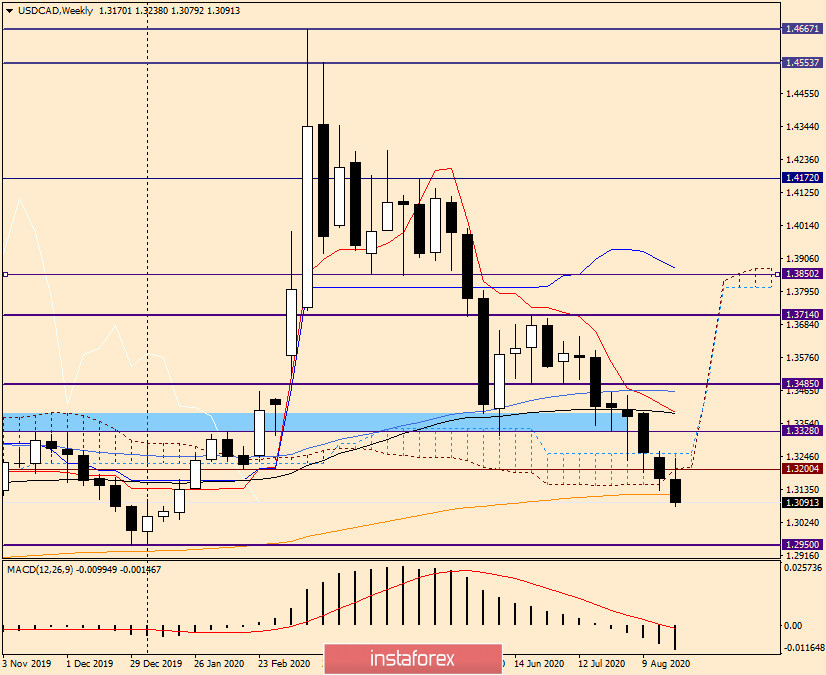
The weekly chart clearly shows that the pair is under quite strong selling pressure. If the bears failed to push the price down from the Ichimoku indicator cloud at last week's trading, then the pair is already trading under the lower border of the cloud and breaks through the 200 exponential moving average.
If the downward trend continues, the pair risks falling into the strong technical area of 1.3000-1.2950, where the psychological level and the lows of December 2019 pass. If market sentiment changes in favor of the US currency, the USD/CAD pair may return above 200 EMA and end the week's trading at least within the Ichimoku cloud. To be honest, this development is hard to believe, however, the pair will have to survive a block of important macroeconomic statistics, so it is too early to draw final conclusions. One thing is clear - the market is still negative against the US dollar, and Powell's speech only increased the pressure on the USD.
Daily

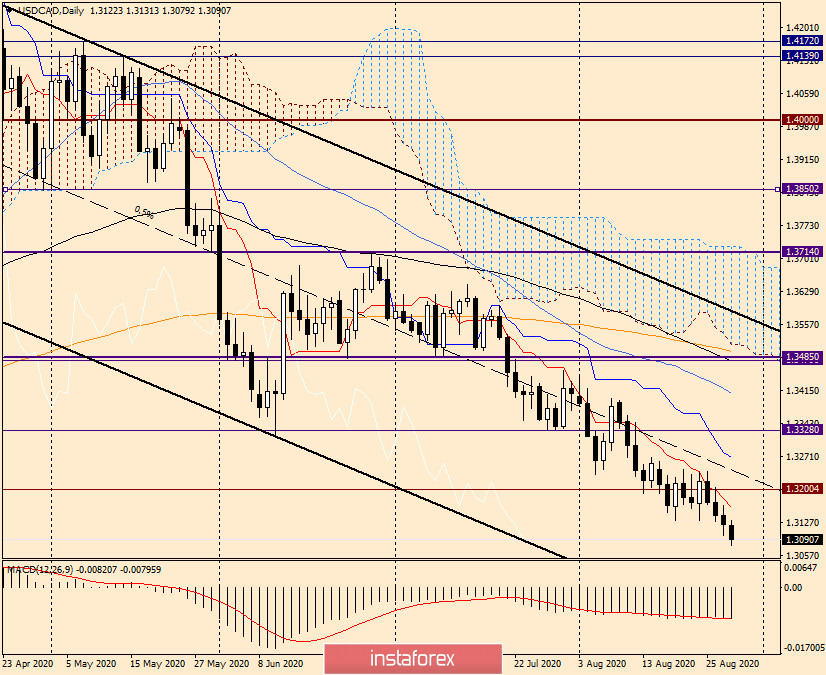
I built a descending channel with parameters on the daily chart: 1.4263-1.4139 (resistance line) and 1.3314 (support line). The pair is traded in the lower part of the channel, that is, under the middle dotted line. This factor indicates bearish sentiment for USD/CAD and more likely suggests a further decline in the instrument. However, to sell at the bottom of the market, and even after such a long decline, I think it is unwise. I recommend waiting for a pullback to 1.3160, where the broken Tenkan line runs, or to the middle line of the channel, which is near 1.3230, and from there consider opening short positions on USD/CAD. However, it is not a fact that such rollbacks will take place (if at all) today, so those who are guided by the daily chart need to be patient.
H1

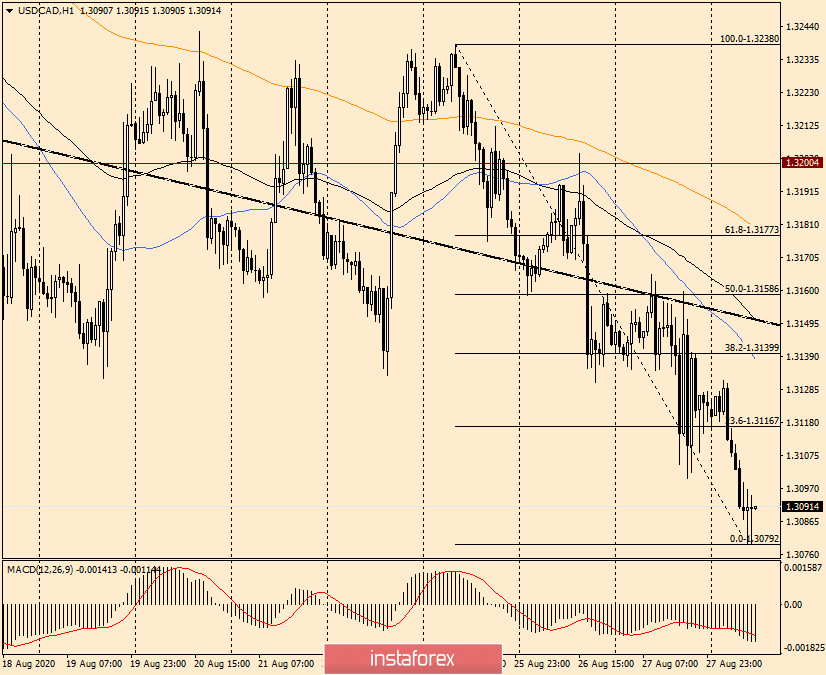
But on the hourly chart, we see that there is a reversal. Most likely, this will be a correction to the previous decline of the pair. If so, I recommend considering sales after rising to the first two corrective levels of 23.6 and 38.2 on the Fibonacci grid, stretched for a fall of 1.3238-1.3079. In general, I keep a bearish view on USD/CAD and recommend looking for options to open short positions after corrective pullbacks.
 English
 Русский
 Bahasa Indonesia
 Bahasa Malay
 ไทย
ไทย Español
 Deutsch
 Български
 Français
 Tiếng Việt
 中文
中文 বাংলা
বাংলা हिन्दी
 Čeština
 Українська
 Română

