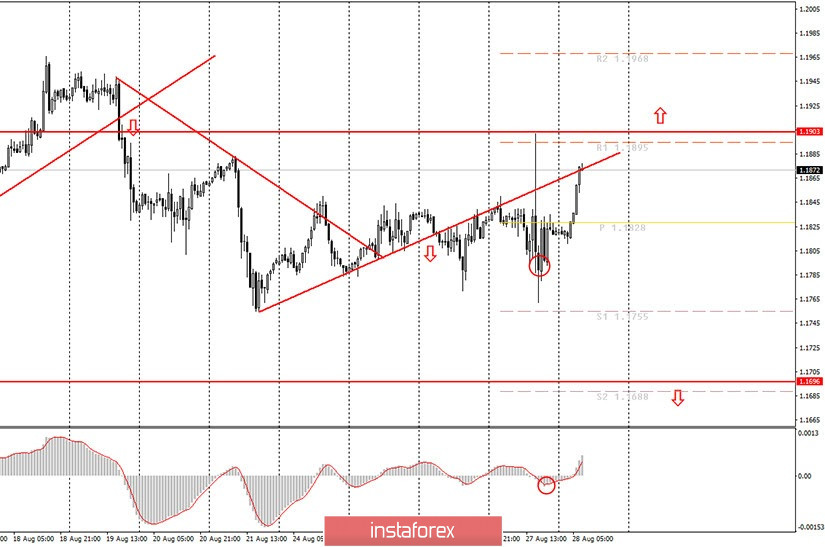
Hourly chart of the EUR/USD pair

The EUR/USD pair unexpectedly traded very actively during Friday night trading. But that's what we talked about in yesterday evening's review. Markets need to be given time to calm down after Federal Reserve Chairman Jerome Powell's speech yesterday. As you can see, they have not yet calmed down by the morning of August 28 and are still under the impression. Thus, the quotes of the euro/dollar pair have returned to the upward trend line and are reaching from below(!!!). But there is no ascending trend line (new and relevant) or an upside channel at this time, since the price has been moving mostly sideways for most of the current week. Thus, novice traders still do not have any signals and patterns at their disposal in order to trade bullish. Meanwhile, quotes are approaching the 1.1903 level , which is the upper line of the side channel, in which the pair has been trading for more than a month. If this level is crossed, the chances of resuming the upward trend will sharply increase. At the same time, we would like to remind you that the price also crossed this level on August 18-19, after which it started to calmly fall. Therefore, we still recommend that you focus on trend lines and channels when trading. Now there is nothing like that.
The calendar of macroeconomic events for the European Union is empty again on August 28. Meanwhile, the Economic Symposium in Jackson Hole will continue in the United States, but no high-profile speeches concerning the euro or the dollar are planned for today. Thus, novice traders will have nothing to pay attention to today. We could recommend considering the reports on changes in the volume of personal income and spending of Americans for July or the consumer confidence index, but we believe that these reports will not cause any market reaction. Especially after Powell's speech from yesterday, which is why the pair is still extremely actively trading. At the same time, US President Donald Trump officially gave his consent to run for president for a second term. This decision was made at the convention of the US Republican Party, although it has long been clear to everyone that Trump is the only Republican presidential candidate. It is ironic that his official consent was just announced, and the US dollar collapsed by 55 points against the euro right after this. In any case, the US president seems to continue to be the main supplier of fundamental information, and traders are closely monitoring the development of the conflict with China and a new wave of rallies and protests caused by a new racial scandal in America.
Possible scenarios for August 28:
1) It is still not recommended to consider buying the pair at this time, since there is no clear upward trend at the disposal of traders. It was possible to use the 1.1850 level as a signal for buying (we wrote about it in our earlier reviews). This is the level from which the price rebounded twice earlier. Overcoming it makes it possible to count on growth to 1.1895 and 1.1903. However, this is a rather dangerous signal.
2) Selling the pair, after yesterday's trading, also became irrelevant, as the price surpassed all local highs of the last days. Accordingly, the upward movement has resumed. However, we do not have a trend line, channel, or other pattern that clearly shows an upward trend. Thus, we recommend that novice traders do not take unnecessary risks and wait until the markets calm down and form a new, "calm" trend, within which it will be possible to trade.
On the chart:
Support and Resistance Levels are the Levels that serve as targets when buying or selling the pair. You can place Take Profit near these levels.
Red lines are the channels or trend lines that display the current trend and show in which direction it is better to trade now.
Up/down arrows show where you should sell or buy after reaching or breaking through particular levels.
The MACD indicator consists of a histogram and a signal line. When they cross, this is a signal to enter the market. It is recommended to use this indicator in combination with trend lines (channels and trend lines).
Important announcements and economic reports that you can always find in the news calendar can seriously influence the trajectory of a currency pair. Therefore, at the time of their release, we recommended trading as carefully as possible or exit the market in order to avoid a sharp price reversal.
Beginners on Forex should remember that not every single trade has to be profitable. The development of a clear strategy and money management are the key to success in trading over a long period of time.
 English
 Русский
 Bahasa Indonesia
 Bahasa Malay
 ไทย
ไทย Español
 Deutsch
 Български
 Français
 Tiếng Việt
 中文
中文 বাংলা
বাংলা हिन्दी
 Čeština
 Українська
 Română

